Long Beach: Fire Incidents, New York (NY)
Where are fire incidents reported in Long Beach, NY
Something went wrong! Please refresh the page.
| Fire incidents reported | |
|---|---|
| Sreet name | Count |
| CHESTER ST W | 140 |
| E PARK AVE | 114 |
| W PARK AVE | 112 |
| SHORE RD | 100 |
| W BROADWAY | 72 |
| MUTUAL AID TO LONG BEACH | 68 |
| E BROADWAY | 60 |
| E PINE ST | 52 |
| W CHESTER ST | 48 |
| LONG BEACH BLVD | 46 |
| PARK AVE W | 42 |
| E WALNUT ST | 40 |
| W WALNUT ST | 36 |
| W BEECH ST | 34 |
| RIVERSIDE BLVD | 32 |
| W FULTON ST | 32 |
| E BEECH ST | 30 |
| NEPTUNE BLVD | 30 |
| E FULTON ST | 28 |
| E HUDSON ST | 26 |
| E MARKET ST | 26 |
| E PENN ST | 26 |
| LINCOLN BLVD | 26 |
| E BAY DR | 24 |
| EDWARDS BLVD | 24 |
| MONROE BLVD | 24 |
| E OLIVE ST | 22 |
| NATIONAL BLVD | 22 |
| OCEANFRONT | 22 |
| LONG BEACH FIRE DEPT - HQ | 20 |
2003 - 2018 National Fire Incident Reporting System (NFIRS) incidents
- Incident types reported to NFIRS in Long Beach, NY
- 13,62465.2%Rescue & EMS
- 2,68412.8%Hazardous Condition
- 2,19910.5%False Alarm
- 1,0455.0%Fire
- 7113.4%Good Intent Call
- 5662.7%Service Call
- 360.2%Special Incident
- 350.2%Overpressure Rupture
- Fire incident types reported to NFIRS in Long Beach, NY
- 53851.5%Structure Fires
- 30128.8%Outside Fires
- 13713.1%Other
- 696.6%Mobile Property/Vehicle Fires
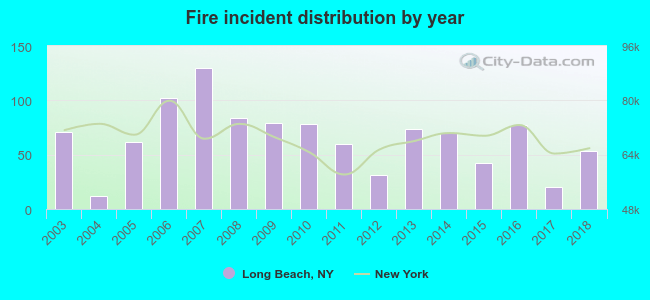 According to the data from the years 2003 - 2018 the average number of fires per year is 65. The highest number of reported fire incidents - 130 took place in 2007, and the least - 12 in 2004. The data has a dropping trend.
The average number of yearly fire incidents per 10k residents in Long Beach, NY compared to nearest cities:
(Note: Based on data for the last 3 years, including only cities with population 5,000 and above)
| Long Beach: | 14.9 |
| Lawrence: | 38.2 |
| Oceanside: | 8.7 |
| East Rockaway: | 1.5 |
| Hewlett: | 12.7 |
| Cedarhurst: | 28.5 |
| Woodmere: | 17.7 |
| Inwood: | 65.4 |
| Lynbrook: | 6.6 |
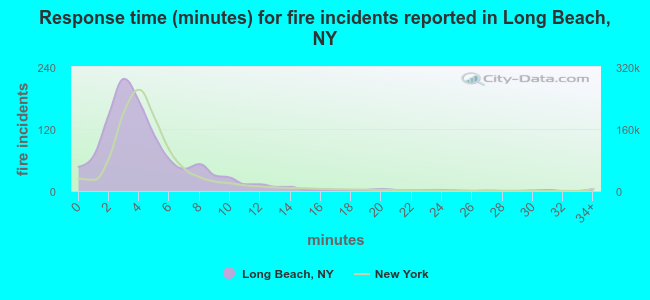 The median response time based on all reported fire incidents is 4 minutes. This is similar to the state median value.
The median response time in Long Beach, NY compared to nearest cities:
(Note: Based on data for all years, including only cities with at least 500 fire incidents)
| Long Beach: | 4 minutes |
| Oceanside: | 4 minutes |
| Lynbrook: | 3 minutes |
| Valley Stream: | 4 minutes |
| Baldwin: | 4 minutes |
| Freeport: | 3 minutes |
| West Hempstead: | 0 minutes |
| Franklin Square: | 4 minutes |
| Elmont: | 5 minutes |
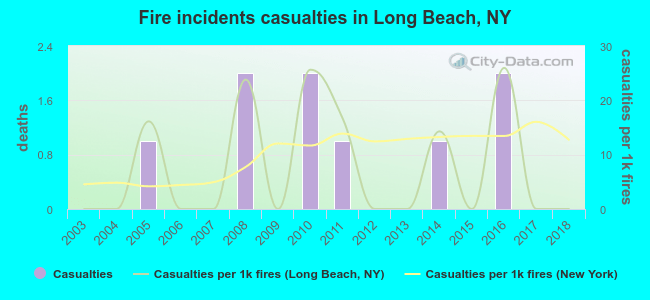 Based on the reports from the years 2003 - 2018 the average number of fire-related yearly casualties is 1. The highest number of casualties - 2 took place in 2008, and the lowest - 0 in 2003. The data has a constant trend.
The average number of casualties per 1,000 fires is 8. This indicator was the highest - 26 in 2016, and the lowest 0 in 2003. The trend for casualties per 1,000 fires is constant. Compared to the state value the number of casualties per 1,000 fire incidents is similar.
Based on the reports from the years 2003 - 2018 the average number of fire-related yearly casualties is 1. The highest number of casualties - 2 took place in 2008, and the lowest - 0 in 2003. The data has a constant trend.
The average number of casualties per 1,000 fires is 8. This indicator was the highest - 26 in 2016, and the lowest 0 in 2003. The trend for casualties per 1,000 fires is constant. Compared to the state value the number of casualties per 1,000 fire incidents is similar.Casualties per 1,000 incidents in Long Beach, NY compared to nearest cities:
(Note: Based on data for all years, including only cities with at least 500 fire incidents)
| Long Beach: | 8.6 |
| Oceanside: | 12.8 |
| Lynbrook: | 43.6 |
| Valley Stream: | 10.0 |
| Baldwin: | 1.2 |
| Freeport: | 46.4 |
| West Hempstead: | 0.0 |
| Franklin Square: | 9.7 |
| Elmont: | 0.0 |
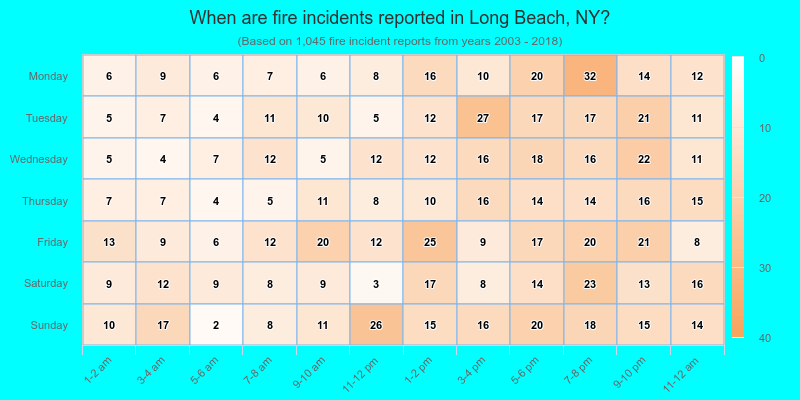
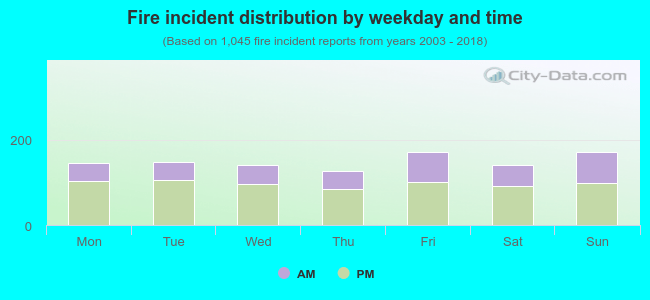 35.1% incidents where reported in the morning and 64.9% in the evening. The most fires (16.5%) took place on Friday, and the least (12.2%) on Thursday.
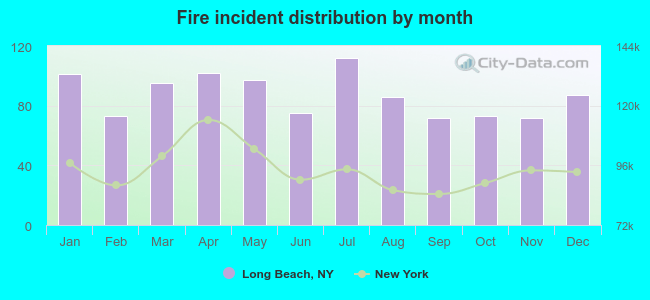 Based on the 1,045 incident reports from years 2003 - 2018 most fires (10.7%) took place during July, and the least (6.9%) in September.
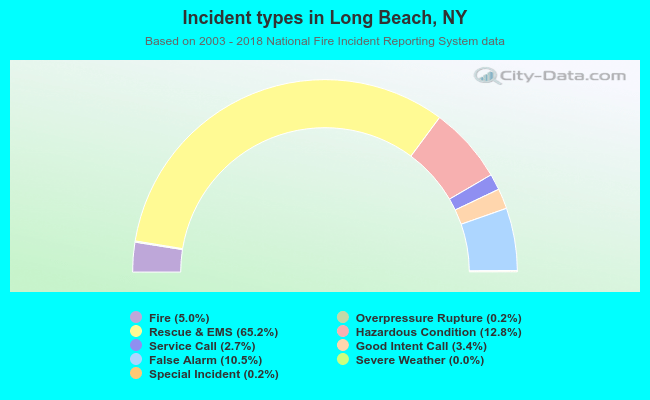 Out of all 20,906 cases reported during the years 2003 - 2018, the most belonged to the categories: Rescue & EMS (65.2%), Hazardous Condition (12.8%), and False Alarm (10.5%).
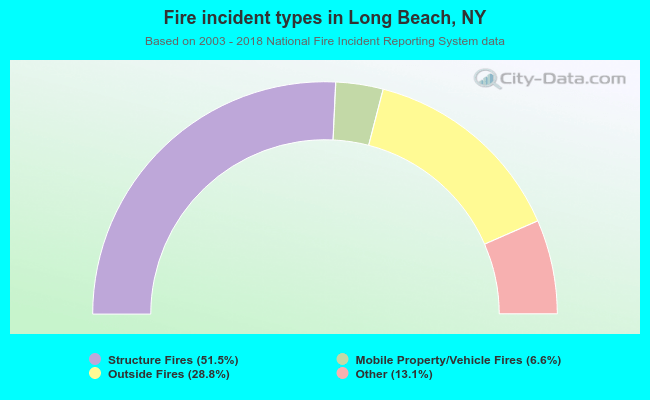 When looking into fire subcategories, the most reports belonged to: Structure Fires (51.5%), and Outside Fires (28.8%).