Loudon: Fire Incidents, New Hampshire (NH)
Where are fire incidents reported in Loudon, NH
Something went wrong! Please refresh the page.
|
| |||||||||||||||||||||||||||||||||||||||||||||||||||||||||||||||||||||||||||||||||||||||||||||||||||||||||||||
2002 - 2018 National Fire Incident Reporting System (NFIRS) incidents
- Incident types reported to NFIRS in Loudon, NH
- 2,43046.1%Rescue & EMS
- 85516.2%Hazardous Condition
- 70213.3%Service Call
- 67512.8%Fire
- 3125.9%Good Intent Call
- 2514.8%False Alarm
- 310.6%Severe Weather
- 70.1%Special Incident
- Fire incident types reported to NFIRS in Loudon, NH
- 37856.0%Structure Fires
- 20430.2%Outside Fires
- 598.7%Mobile Property/Vehicle Fires
- 345.0%Other
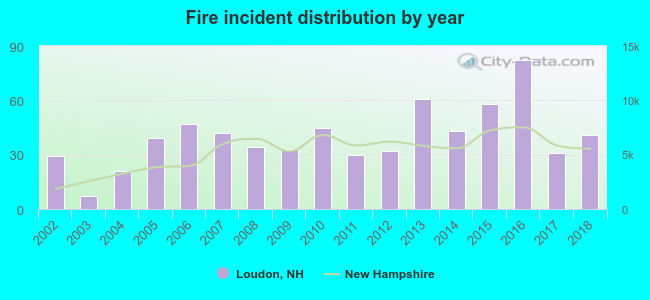 According to the data from the years 2002 - 2018 the average number of fires per year is 40. The highest number of fire incidents - 82 took place in 2016, and the least - 7 in 2003. The data has a rising trend.
The average number of yearly fire incidents per 10k residents in Loudon, NH compared to nearest cities:
(Note: Based on data for the last 3 years, including only cities with population 5,000 and above)
| Loudon: | 96.5 |
| Concord: | 41.9 |
| Pembroke: | 20.6 |
| Belmont: | 80.2 |
| Bow: | 72.7 |
| Franklin: | 67.6 |
| Hopkinton: | 66.8 |
| Alton: | 78.7 |
| Laconia: | 91.7 |
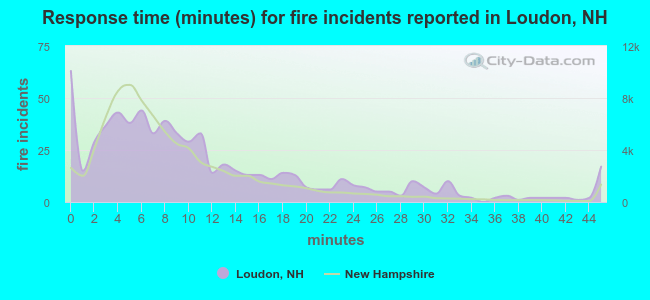 The median response time based on all reported fire incidents is 8 minutes. This is close to the New Hampshire median value.
The median response time in Loudon, NH compared to nearest cities:
(Note: Based on data for all years, including only cities with at least 500 fire incidents)
| Loudon: | 8 minutes |
| Pittsfield: | 10 minutes |
| Concord: | 5 minutes |
| Epsom: | 10 minutes |
| Northfield: | 8 minutes |
| Belmont: | 9 minutes |
| Tilton: | 7 minutes |
| Bow: | 8 minutes |
| Franklin: | 7 minutes |
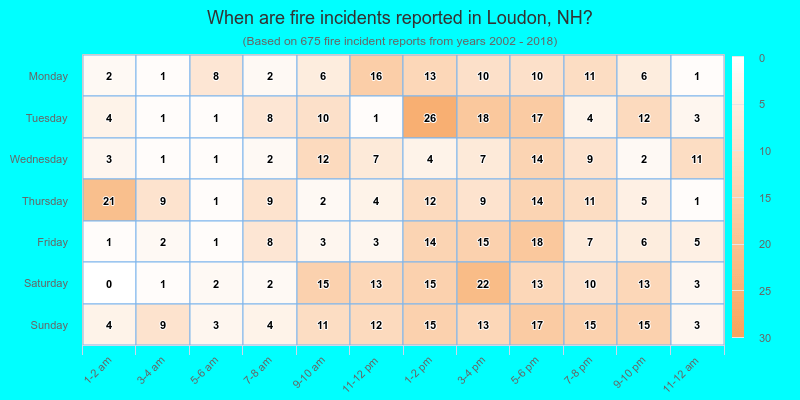
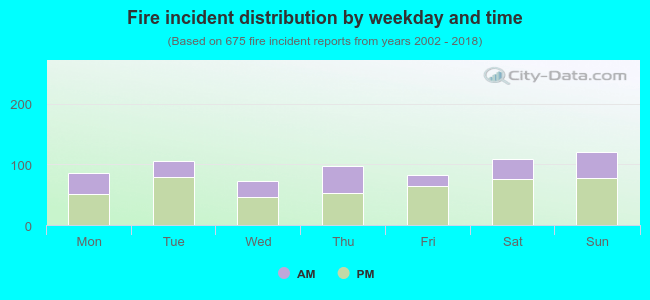 33.5% incidents where reported in the morning and 66.5% in the evening. The most fires (17.9%) took place on Sunday, and the least (10.8%) on Wednesday.
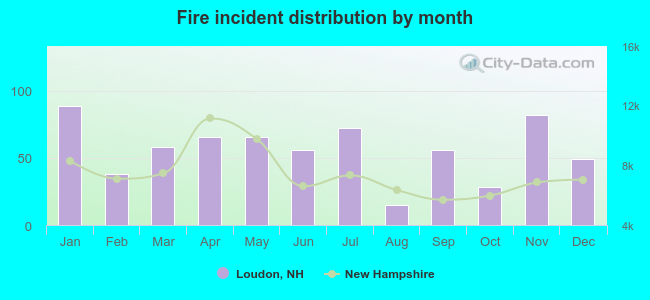 Based on the 675 reports from years 2002 - 2018 most fires (13.2%) took place during January, and the least (2.2%) in August.
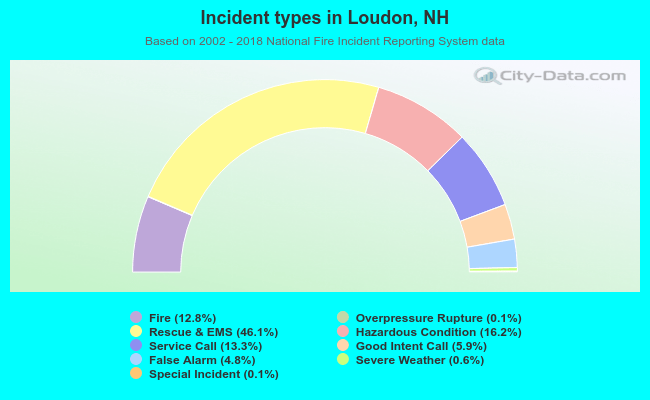 Out of all 5,267 cases reported during the years 2002 - 2018, the most belonged to the categories: Rescue & EMS (46.1%), Hazardous Condition (16.2%), and Service Call (13.3%).
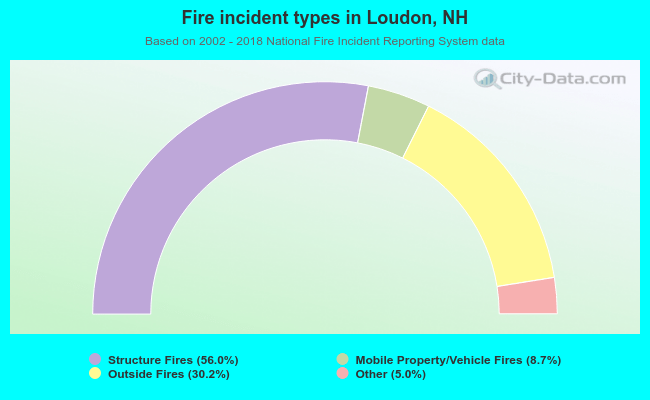 When looking into fire subcategories, the most reports belonged to: Structure Fires (56.0%), and Outside Fires (30.2%).