Lovelock: Fire Incidents, Nevada (NV)
Where are fire incidents reported in Lovelock, NV
Something went wrong! Please refresh the page.
|
| |||||||||||||||||||||||||||||||||||||||||||||||||||||||||||||||||||||||||||||||||||||||||||||||||||||||||||||
2004 - 2018 National Fire Incident Reporting System (NFIRS) incidents
- Incident types reported to NFIRS in Lovelock, NV
- 26064.8%Fire
- 5714.2%Hazardous Condition
- 379.2%Good Intent Call
- 317.7%Rescue & EMS
- 82.0%Service Call
- 41.0%False Alarm
- 41.0%Severe Weather
- Fire incident types reported to NFIRS in Lovelock, NV
- 15760.4%Outside Fires
- 4718.1%Mobile Property/Vehicle Fires
- 4216.2%Structure Fires
- 145.4%Other
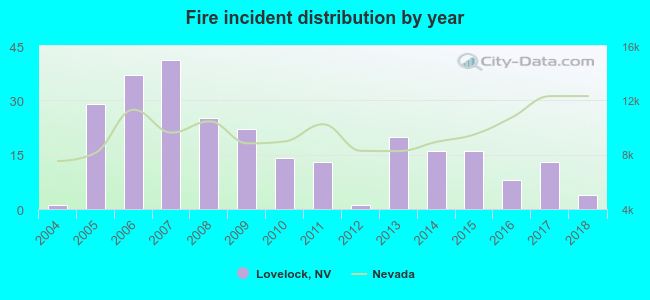 According to the data from the years 2004 - 2018 the average number of fires per year is 17. The highest number of fire incidents - 41 took place in 2007, and the least - 1 in 2004. The data has a rising trend.
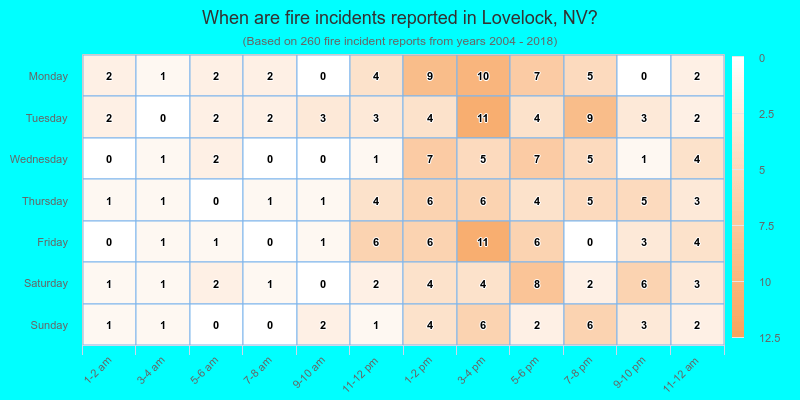
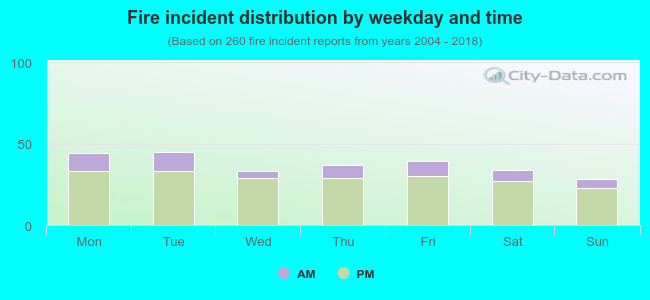 21.5% incidents where reported in the morning and 78.5% in the evening. The most fires (17.3%) took place on Tuesday, and the least (10.8%) on Sunday.
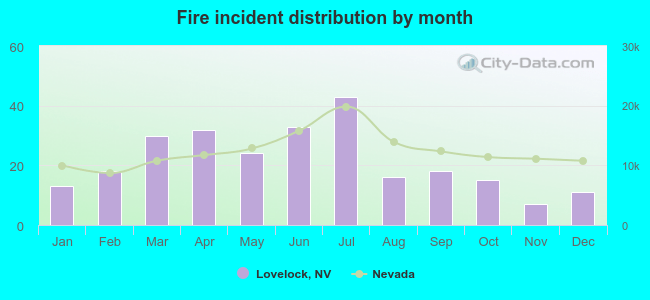 According to the 260 incident reports from years 2004 - 2018 most fires (16.5%) took place during July, and the least (2.7%) in November.
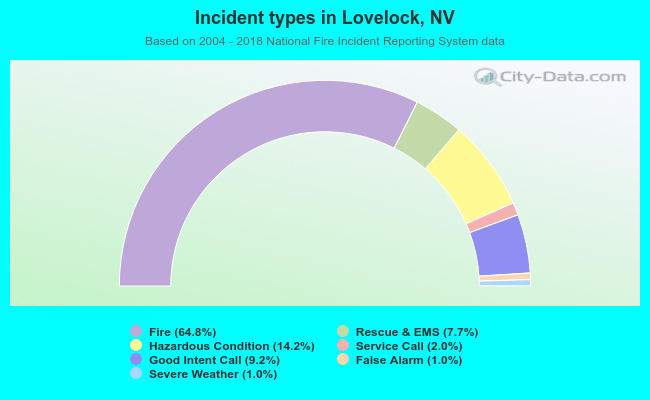 Out of all 401 cases reported during the years 2004 - 2018, the most belonged to the categories: Fire (64.8%), Rescue & EMS (14.2%), and Service Call (9.2%).
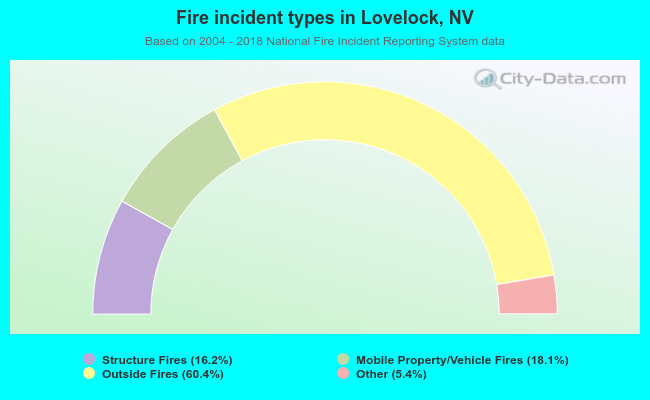 When looking into fire subcategories, the most incidents belonged to: Outside Fires (60.4%), and Mobile Property/Vehicle Fires (18.1%).