Ludington: Fire Incidents, Michigan (MI)
Where are fire incidents reported in Ludington, MI
Something went wrong! Please refresh the page.
|
| |||||||||||||||||||||||||||||||||||||||||||||||||||||||||||||||||||||||||||||||||||||||||||||||||||||||||||||
| Other | 36 | |||||||||||||||||||||||||||||||||||||||||||||||||||||||||||||||||||||||||||||||||||||||||||||||||||||||||||||
2002 - 2018 National Fire Incident Reporting System (NFIRS) incidents
- Incident types reported to NFIRS in Ludington, MI
- 3,87849.9%Rescue & EMS
- 1,53719.8%Hazardous Condition
- 1,21015.6%Fire
- 6538.4%Good Intent Call
- 2262.9%Service Call
- 2212.8%False Alarm
- 210.3%Severe Weather
- 120.2%Special Incident
- 110.1%Overpressure Rupture
- Fire incident types reported to NFIRS in Ludington, MI
- 66955.3%Structure Fires
- 32626.9%Outside Fires
- 16513.6%Mobile Property/Vehicle Fires
- 504.1%Other
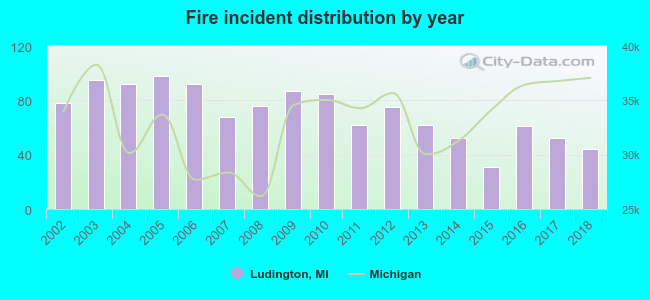 According to the data from the years 2002 - 2018 the average number of fires per year is 71. The highest number of fires - 98 took place in 2005, and the least - 31 in 2015. The data has a dropping trend.
The average number of yearly fire incidents per 10k residents in Ludington, MI compared to nearest cities:
(Note: Based on data for the last 3 years, including only cities with population 5,000 and above)
| Ludington: | 64.8 |
| Manistee: | 54.7 |
| Big Rapids: | 63.8 |
| Muskegon: | 62.4 |
| Muskegon Heights: | 78.7 |
| Norton Shores: | 37.9 |
| Cadillac: | 110.0 |
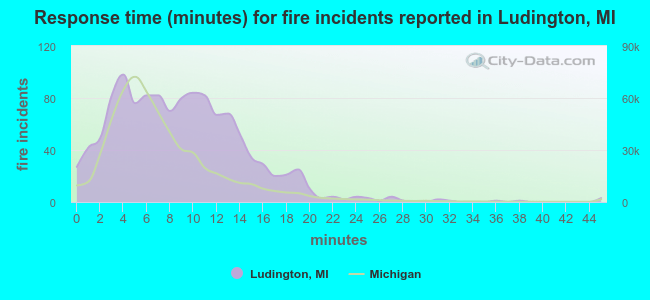 The median response time based on all reported fire incidents is 8 minutes. This is higher compared to the Michigan median value.
The median response time in Ludington, MI compared to nearest cities:
(Note: Based on data for all years, including only cities with at least 500 fire incidents)
| Ludington: | 8 minutes |
| Manistee: | 5 minutes |
| Baldwin: | 9 minutes |
| Whitehall: | 9 minutes |
| Fremont: | 9 minutes |
| Twin Lake: | 10 minutes |
| White Cloud: | 11 minutes |
| Reed City: | 12 minutes |
| Newaygo: | 9 minutes |
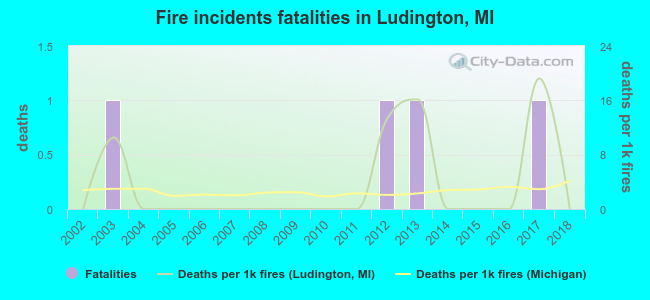 According to the reports from the years 2002 - 2018 the average number of fire-related fatalities per year is 0. The highest number of deaths - 1 took place in 2003, and the lowest - 0 in 2002. The data has a constant trend.
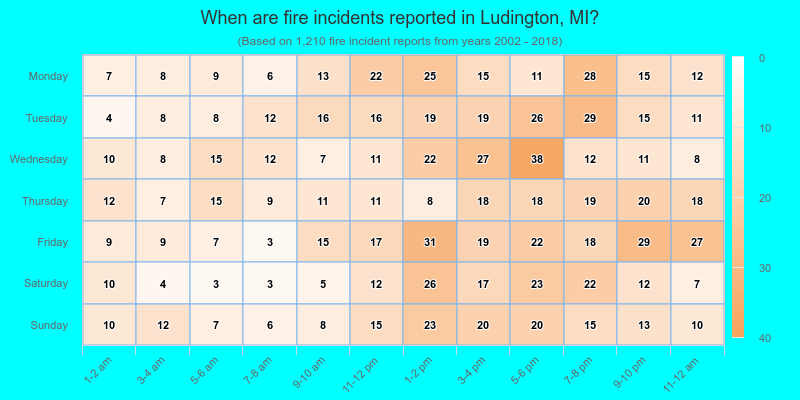
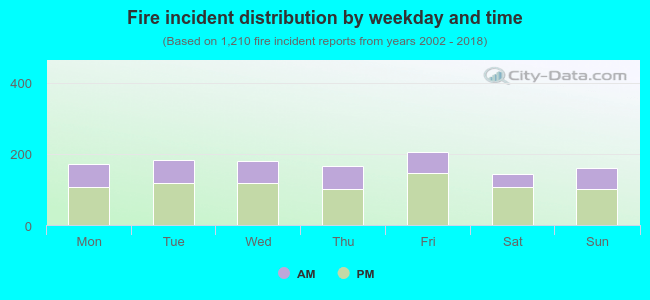 34.0% incidents where reported in the morning and 66.0% in the evening. The most fires (17.0%) took place on Friday, and the least (11.9%) on Saturday.
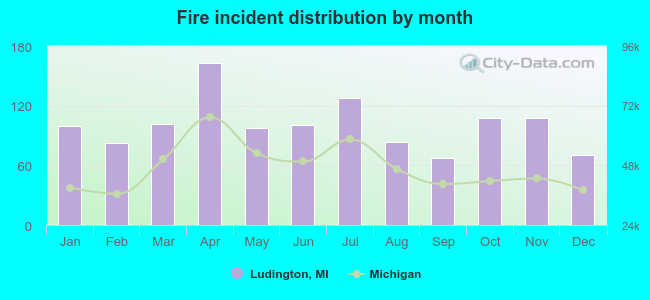 Based on the 1,210 fire incident reports from years 2002 - 2018 most fires (13.5%) took place during April, and the least (5.5%) in September.
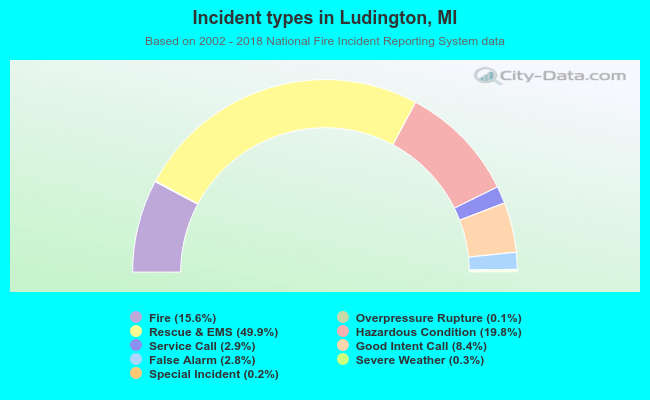 Out of all 7,769 cases reported during the years 2002 - 2018, the most belonged to the categories: Rescue & EMS (49.9%), Hazardous Condition (19.8%), and Fire (15.6%).
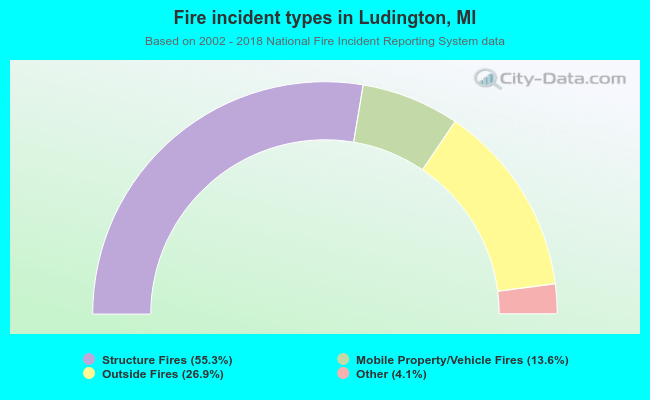 When looking into fire subcategories, the most reports belonged to: Structure Fires (55.3%), and Outside Fires (26.9%).