Madeira Beach: Fire Incidents, Florida (FL)
Where are fire incidents reported in Madeira Beach, FL
Something went wrong! Please refresh the page.
|
| |||||||||||||||||||||||||||||||||||||||||||||||||||||||||||||||||||||||||||||||||||||||||||||||||||||||||||||
2005 - 2018 National Fire Incident Reporting System (NFIRS) incidents
- Incident types reported to NFIRS in Madeira Beach, FL
- 3,72465.2%Rescue & EMS
- 85314.9%Good Intent Call
- 3706.5%Hazardous Condition
- 3355.9%Fire
- 3175.6%False Alarm
- 891.6%Service Call
- 80.1%Overpressure Rupture
- 70.1%Severe Weather
- 70.1%Special Incident
- Fire incident types reported to NFIRS in Madeira Beach, FL
- 16850.1%Structure Fires
- 8926.6%Outside Fires
- 4212.5%Other
- 3610.7%Mobile Property/Vehicle Fires
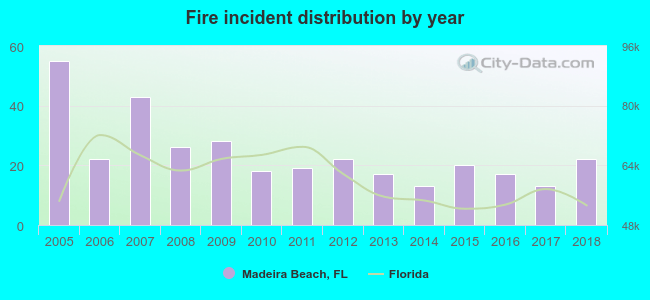 Based on the data from the years 2005 - 2018 the average number of fire incidents per year is 24. The highest number of fire incidents - 55 took place in 2005, and the least - 13 in 2014. The data has a dropping trend.
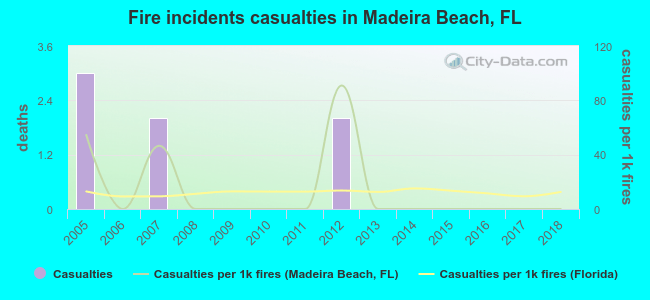 Based on the data from the years 2005 - 2018 the average number of fire-related yearly casualties is 1. The highest number of injuries - 3 took place in 2005, and the lowest - 0 in 2006. The data has a decreasing trend.
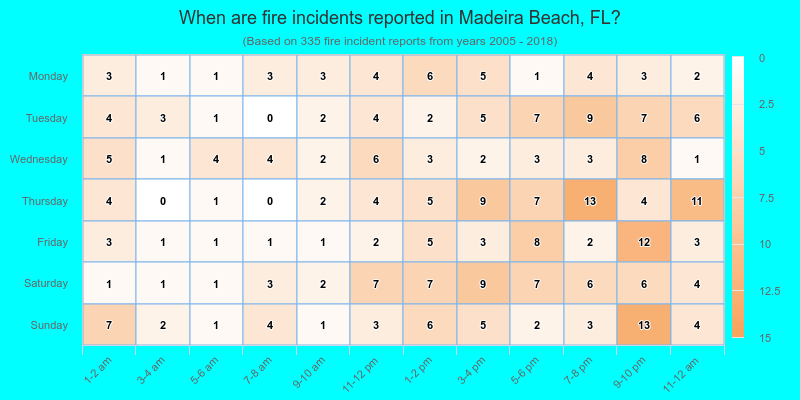
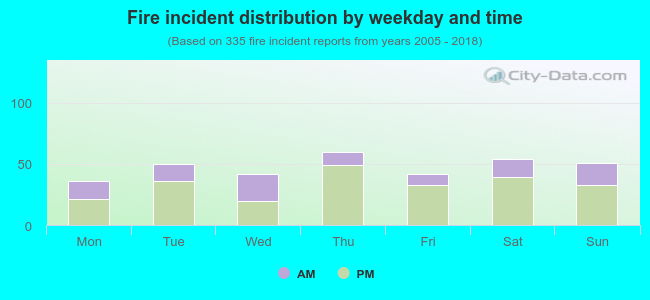 31.0% incidents where reported in the morning and 69.0% in the evening. The most fires (17.9%) took place on Thursday, and the least (10.7%) on Monday.
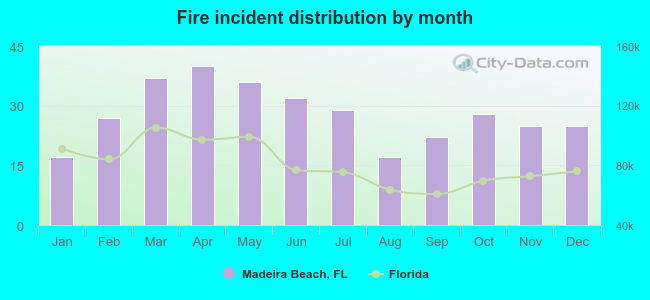 Based on the 335 fire incidents from years 2005 - 2018 most fires (11.9%) took place during April, and the least (5.1%) in January.
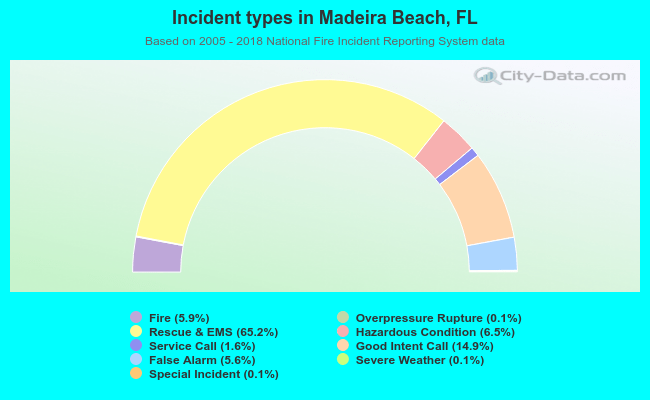 Out of all 5,710 cases reported during the years 2005 - 2018, the most belonged to the categories: Rescue & EMS (65.2%), Good Intent Call (14.9%), and Hazardous Condition (6.5%).
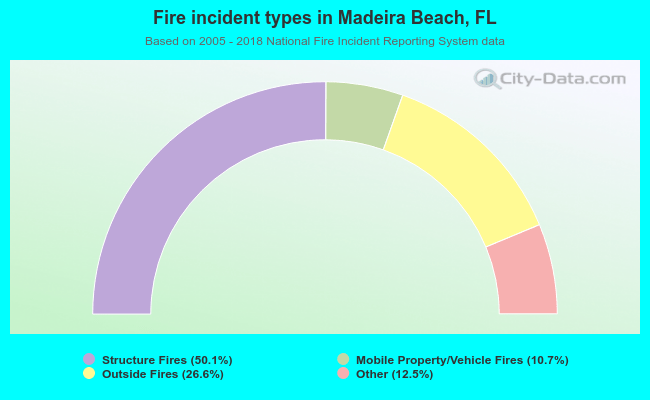 When looking into fire subcategories, the most incidents belonged to: Structure Fires (50.1%), and Outside Fires (26.6%).