Marietta: Fire Incidents, Ohio (OH)
Where are fire incidents reported in Marietta, OH
Something went wrong! Please refresh the page.
| Fire incidents reported | |
|---|---|
| Sreet name | Count |
| PIKE STREET | 112 |
| FRONT STREET | 80 |
| SECOND STREET | 64 |
| THIRD STREET | 64 |
| MUSKINGUM DRIVE | 62 |
| GREENE STREET | 48 |
| FOURTH STREET | 46 |
| GILMAN AVENUE | 44 |
| COLEGATE DRIVE | 40 |
| SEVENTH STREET | 40 |
| INTERSTATE 77 HWY | 38 |
| CISLER DRIVE | 34 |
| FIFTH STREET | 34 |
| LANCASTER STREET | 32 |
| MONTGOMERY STREET | 32 |
| FRANKLIN STREET | 30 |
| SR 7 RT | 26 |
| STATE ROUTE 60 HWY | 26 |
| ST RT 7 | 24 |
| STATE ROUTE 821 HWY | 24 |
| GLENDALE ROAD | 22 |
| STATE ROUTE 7 | 22 |
| ALDERMAN STREET | 20 |
| MARKET STREET | 20 |
| ST RT 7 | 20 |
| VIRGINIA STREET | 20 |
| COUNTY HOUSE LANE | 18 |
| MASONIC PARK RD | 18 |
| ACME STREET | 16 |
| HARMAR STREET | 16 |
| Other | 475 |
2002 - 2018 National Fire Incident Reporting System (NFIRS) incidents
- Incident types reported to NFIRS in Marietta, OH
- 1,62929.8%Hazardous Condition
- 1,56728.7%Fire
- 89216.3%False Alarm
- 59210.8%Rescue & EMS
- 3546.5%Service Call
- 2965.4%Good Intent Call
- 771.4%Special Incident
- 290.5%Severe Weather
- 260.5%Overpressure Rupture
- Fire incident types reported to NFIRS in Marietta, OH
- 62339.8%Structure Fires
- 59337.8%Outside Fires
- 32820.9%Mobile Property/Vehicle Fires
- 231.5%Other
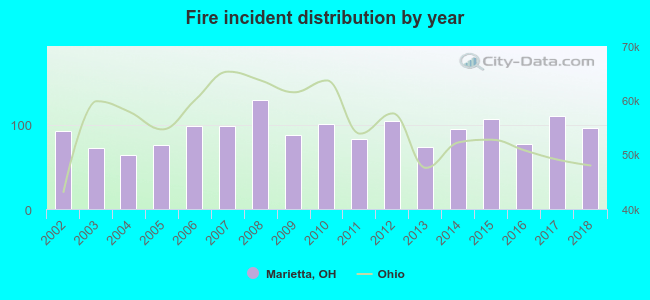 Based on the data from the years 2002 - 2018 the average number of fire incidents per year is 92. The highest number of reported fire incidents - 129 took place in 2008, and the least - 64 in 2004. The data has an increasing trend.
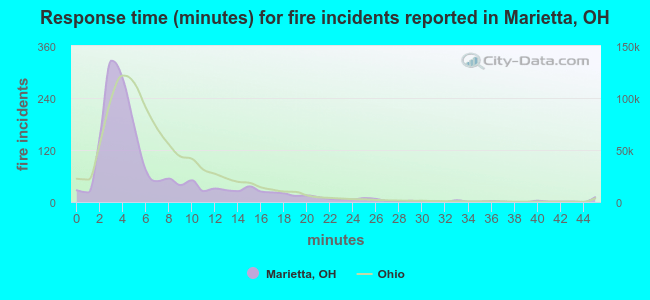 The median response time based on all reported fire incidents is 4 minutes. This is lower compared to the state median value.
The median response time in Marietta, OH compared to nearest cities:
(Note: Based on data for all years, including only cities with at least 500 fire incidents)
| Marietta: | 4 minutes |
| Belpre: | 7 minutes |
| Glouster: | 7 minutes |
| Athens: | 5 minutes |
| Byesville: | 9 minutes |
| Quaker City: | 12 minutes |
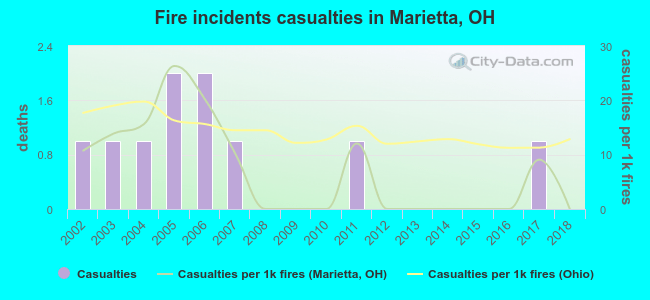 Based on the reports from the years 2002 - 2018 the average number of fire-related yearly casualties is 1. The highest number of reported casualties - 2 took place in 2005, and the lowest - 0 in 2008. The data has a decreasing trend.
The average number of casualties per 1,000 fires is 7. This indicator was the highest - 26 in 2005, and the lowest 0 in 2008. The trend for casualties per 1,000 fires is declining. Compared to the state value the number of injuries per 1,000 fires is much lower.
Based on the reports from the years 2002 - 2018 the average number of fire-related yearly casualties is 1. The highest number of reported casualties - 2 took place in 2005, and the lowest - 0 in 2008. The data has a decreasing trend.
The average number of casualties per 1,000 fires is 7. This indicator was the highest - 26 in 2005, and the lowest 0 in 2008. The trend for casualties per 1,000 fires is declining. Compared to the state value the number of injuries per 1,000 fires is much lower.Casualties per 1,000 incidents in Marietta, OH compared to nearest cities:
(Note: Based on data for all years, including only cities with at least 500 fire incidents)
| Marietta: | 6.4 |
| Belpre: | 7.0 |
| Glouster: | 3.7 |
| Athens: | 11.4 |
| Byesville: | 5.6 |
| Quaker City: | 0.0 |
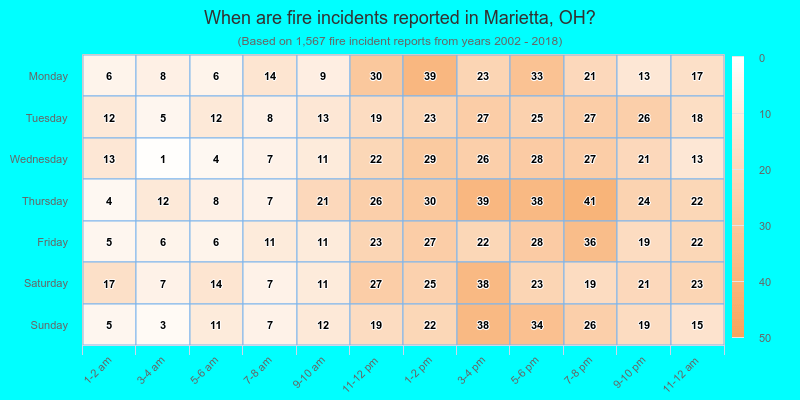
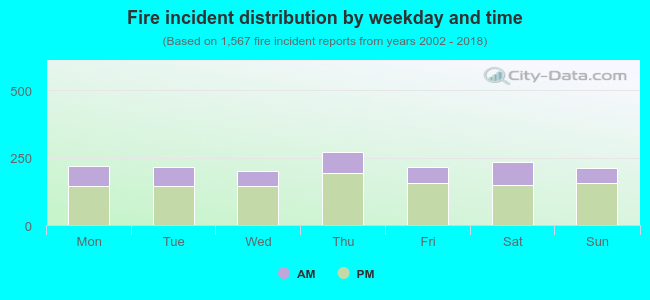 30.6% incidents where reported in the morning and 69.4% in the evening. The most fires (17.4%) took place on Thursday, and the least (12.9%) on Wednesday.
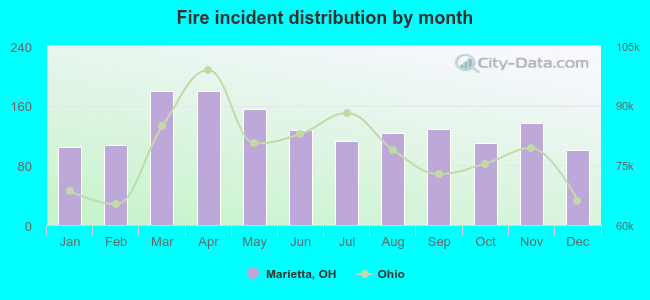 According to the 1,567 fire incident reports from years 2002 - 2018 most fires (11.5%) took place during March, and the least (6.4%) in December.
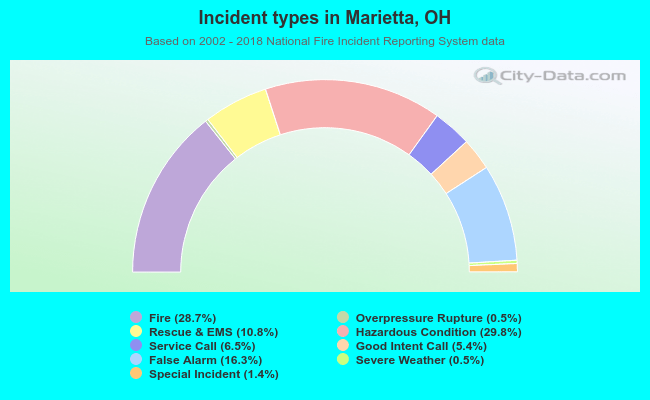 Out of all 5,462 cases reported during the years 2002 - 2018, the most belonged to the categories: Hazardous Condition (29.8%), Fire (28.7%), and False Alarm (16.3%).
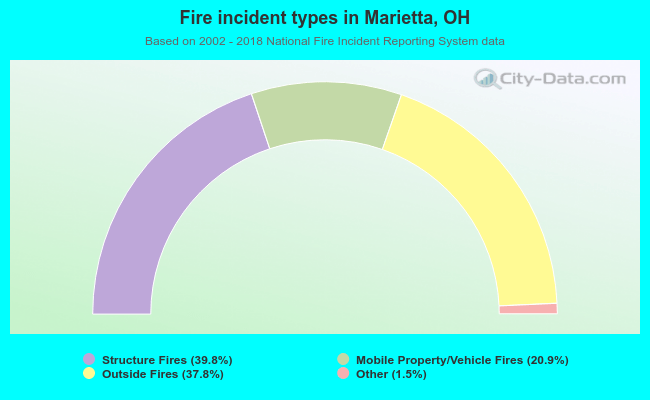 When looking into fire subcategories, the most reports belonged to: Structure Fires (39.8%), and Outside Fires (37.8%).