Marion: Fire Incidents, Ohio (OH)
Where are fire incidents reported in Marion, OH
Something went wrong! Please refresh the page.
| Fire incidents reported | |
|---|---|
| Sreet name | Count |
| MAIN ST | 228 |
| CENTER ST | 216 |
| PROSPECT ST | 202 |
| MARION WALDO RD | 140 |
| STATE ST | 134 |
| OWENS RD | 130 |
| FAIRGROUND ST | 116 |
| SMELTZER RD | 112 |
| WYANDOT AVE | 90 |
| CHURCH ST | 86 |
| MARION CARDINGTON RD | 84 |
| SILVER ST | 82 |
| DELAWARE AVE | 80 |
| DAVIDS ST | 76 |
| BELLEFONTAINE AVE | 70 |
| OAK ST | 70 |
| MARION MARYSVILLE RD | 66 |
| PEARL ST | 66 |
| RICHLAND RD | 64 |
| BARKS RD | 62 |
| GREENWOOD ST | 62 |
| VICTORY RD | 62 |
| HARDING HIGHWAY | 60 |
| HARDING HWY | 60 |
| MARION-AGOSTA RD | 58 |
| COLUMBIA ST | 54 |
| NEWMANS CARDINGTON RD | 52 |
| FARMING ST | 50 |
| GOODING RD | 48 |
| MARION-WALDO RD | 48 |
| Other | 2,020 |
2002 - 2018 National Fire Incident Reporting System (NFIRS) incidents
- Incident types reported to NFIRS in Marion, OH
- 14,47850.4%Rescue & EMS
- 4,74816.5%Fire
- 3,06510.7%Hazardous Condition
- 2,91610.1%Service Call
- 1,7216.0%False Alarm
- 1,6165.6%Good Intent Call
- 1090.4%Special Incident
- 470.2%Overpressure Rupture
- 440.2%Severe Weather
- Fire incident types reported to NFIRS in Marion, OH
- 2,45051.6%Structure Fires
- 1,55632.8%Outside Fires
- 68714.5%Mobile Property/Vehicle Fires
- 551.2%Other
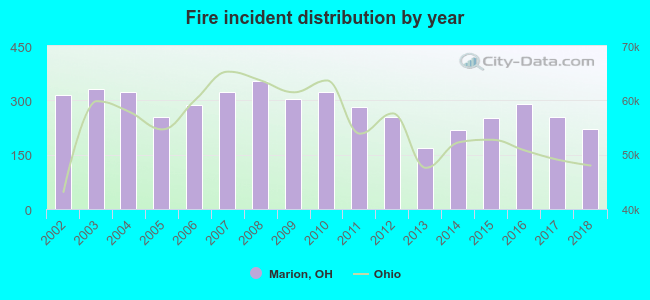 Based on the data from the years 2002 - 2018 the average number of fire incidents per year is 279. The highest number of reported fire incidents - 352 took place in 2008, and the least - 169 in 2013. The data has a decreasing trend.
The average number of yearly fire incidents per 10k residents in Marion, OH compared to nearest cities:
(Note: Based on data for the last 3 years, including only cities with population 5,000 and above)
| Marion: | 69.5 |
| Bucyrus: | 55.4 |
| Upper Sandusky: | 82.3 |
| Delaware: | 54.3 |
| Galion: | 54.7 |
| Kenton: | 112.4 |
| Marysville: | 39.6 |
| Powell: | 33.0 |
| Ontario: | 34.8 |
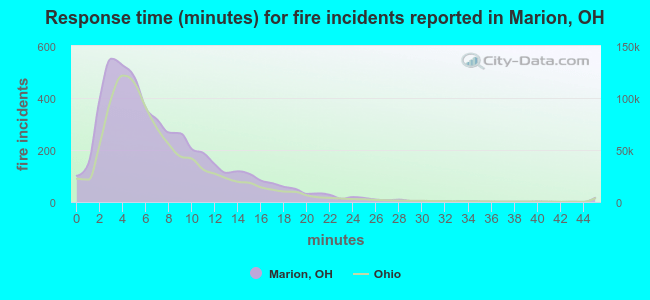 The median response time based on all reported fire incidents is 6 minutes. This is comparable to the state median value.
The median response time in Marion, OH compared to nearest cities:
(Note: Based on data for all years, including only cities with at least 500 fire incidents)
| Marion: | 6 minutes |
| Caledonia: | 8 minutes |
| Cardington: | 9 minutes |
| Richwood: | 9 minutes |
| Ashley: | 9 minutes |
| Bucyrus: | 5 minutes |
| Upper Sandusky: | 7 minutes |
| Delaware: | 7 minutes |
| Galion: | 6 minutes |
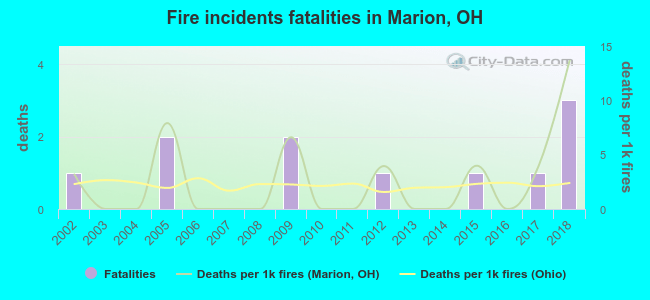 Based on the reports from the years 2002 - 2018 the average number of fire-related yearly deaths is 1. The highest number of reported deaths - 3 took place in 2018, and the lowest - 0 in 2003. The data has a rising trend.
The average number of fatalities per 1,000 fire incidents is 3. This indicator was the highest - 14 in 2018, and the lowest 0 in 2003. The trend for deaths per 1,000 incidents is increasing. Compared to the Ohio value the number of fatalities per 1,000 fires is about the same.
Based on the reports from the years 2002 - 2018 the average number of fire-related yearly deaths is 1. The highest number of reported deaths - 3 took place in 2018, and the lowest - 0 in 2003. The data has a rising trend.
The average number of fatalities per 1,000 fire incidents is 3. This indicator was the highest - 14 in 2018, and the lowest 0 in 2003. The trend for deaths per 1,000 incidents is increasing. Compared to the Ohio value the number of fatalities per 1,000 fires is about the same.
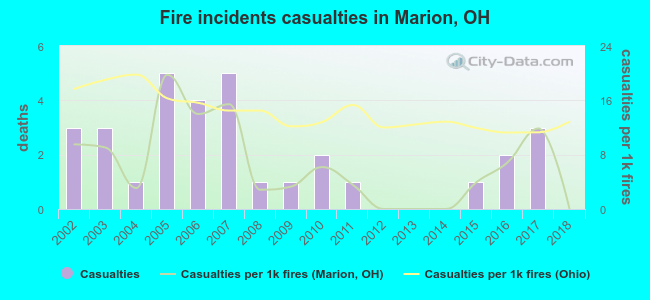 According to the data from the years 2002 - 2018 the average number of fire-related yearly casualties is 2. The highest number of reported injuries - 5 took place in 2005, and the lowest - 0 in 2012. The data has a decreasing trend.
The average number of casualties per 1,000 fire incidents is 6. This indicator was the highest - 20 in 2005, and the lowest 0 in 2012. The trend for casualties per 1,000 fires is dropping. Compared to the Ohio value the number of casualties per 1,000 fires is much lower.
According to the data from the years 2002 - 2018 the average number of fire-related yearly casualties is 2. The highest number of reported injuries - 5 took place in 2005, and the lowest - 0 in 2012. The data has a decreasing trend.
The average number of casualties per 1,000 fire incidents is 6. This indicator was the highest - 20 in 2005, and the lowest 0 in 2012. The trend for casualties per 1,000 fires is dropping. Compared to the Ohio value the number of casualties per 1,000 fires is much lower.Casualties per 1,000 incidents in Marion, OH compared to nearest cities:
(Note: Based on data for all years, including only cities with at least 500 fire incidents)
| Marion: | 6.7 |
| Caledonia: | 5.0 |
| Cardington: | 2.7 |
| Richwood: | 18.7 |
| Ashley: | 5.7 |
| Bucyrus: | 6.9 |
| Upper Sandusky: | 4.9 |
| Delaware: | 16.5 |
| Galion: | 1.8 |
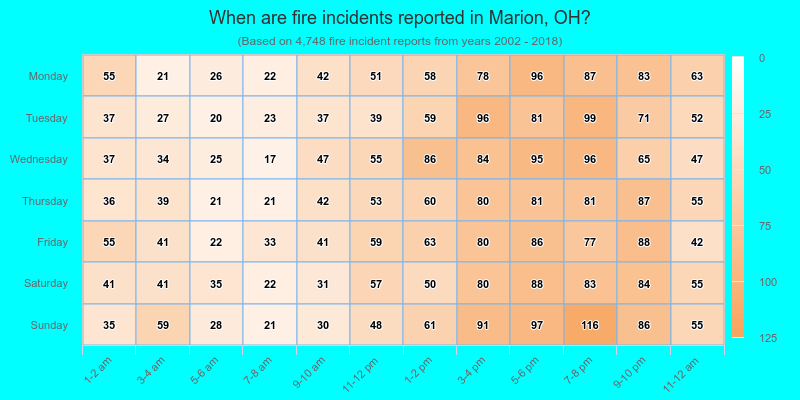
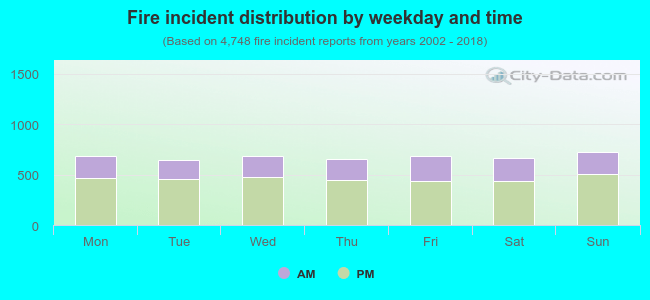 32.1% incidents where reported in the morning and 67.9% in the evening. The most fires (15.3%) took place on Sunday, and the least (13.5%) on Tuesday.
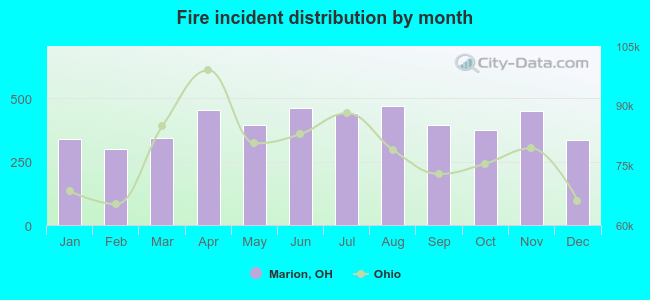 According to the 4,748 fire incident reports from years 2002 - 2018 most fires (9.9%) took place during August, and the least (6.3%) in February.
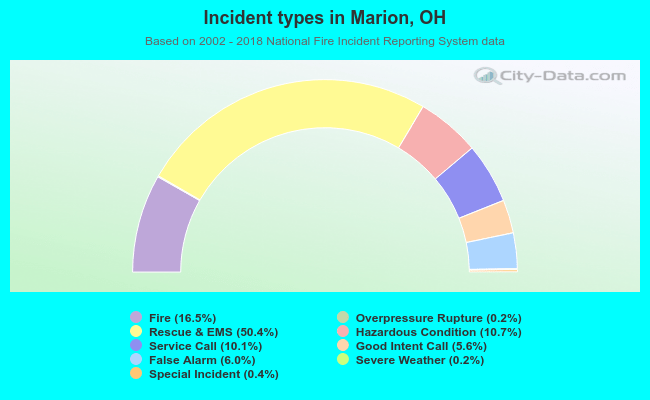 Out of all 28,744 cases reported during the years 2002 - 2018, the most belonged to the categories: Rescue & EMS (50.4%), Fire (16.5%), and Hazardous Condition (10.7%).
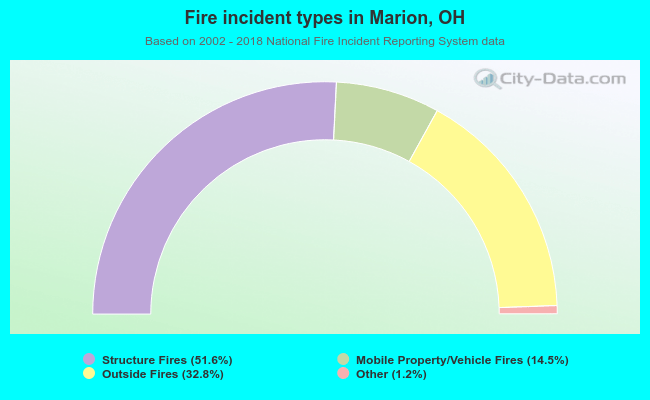 When looking into fire subcategories, the most incidents belonged to: Structure Fires (51.6%), and Outside Fires (32.8%).