| Fire incidents reported |
|---|
| Sreet name | Count |
|---|
| MARLETTE RD | 20 | | MAIN ST | 16 | | FENNER ST | 10 | | MARLETTE ST | 10 | | BOYNE RD | 8 | | ERVIN ST | 8 | | GOSLINE RD | 8 | | FRENCHLINE RD | 6 | | HOWARD RD | 6 | | MORRIS ST | 6 | | VAN DYKE | 6 | | VAN DYKE RD | 6 | | WHITE CREEK RD | 6 | | 3346 MAIN STREET | 4 | | 3737 BAILEY ROAD | 4 | | 8399 INDEX ROAD ST | 4 | | CENTERLINE RD | 4 | | COOPER RD | 4 | | COTTER RD | 4 | | ELMER RD | 4 | | GERMANIA RD | 4 | | HACK DR | 4 | | INDEX RD | 4 | | KOYLETTE RD | 4 | | LILAC ST | 4 |
| | | Fire incidents reported |
|---|
| Sreet name | Count |
|---|
| MARLETTE | 4 | | MAYVILLE RD | 4 | | S VAN DYKE RD | 4 | | SANILAC RD | 4 | | TULANE ST | 4 | | VANDYKE | 4 | | WALKER RD | 4 | | WILSON ST | 4 | | 2109 GERMANIA RD | 2 | | 2150 APPLEGATE ROAD | 2 | | 2200 MARLETTE ROAD | 2 | | 2493 JUAL RD. | 2 | | 2617 S VAN DYKE ROAD | 2 | | 2690 BOYNE ROAD | 2 | | 2739 APPLEGATE ROAD | 2 | | 2750 LORAINE STREET | 2 | | 2865 WILSON ST. | 2 | | 2865 WILSON STREET | 2 | | 3179 ROGERS STREET | 2 | | 3260 FENNER ST | 2 | | 3310 ISLES | 2 | | 3326 AITKEN RD | 2 | | 3571 AITKEN ROAD | 2 | | 3709 SULLIVAN ROAD | 2 | | |
|
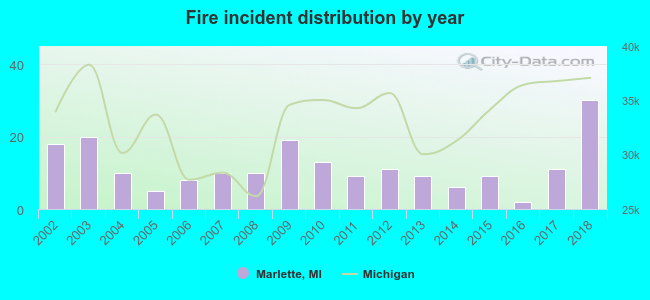 Based on the data from the years 2002 - 2018 the average number of fires per year is 12. The highest number of reported fires - 30 took place in 2018, and the least - 2 in 2016. The data has an increasing trend.
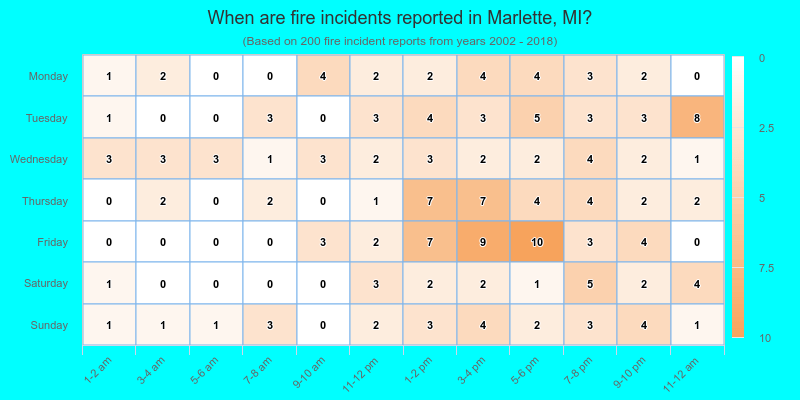
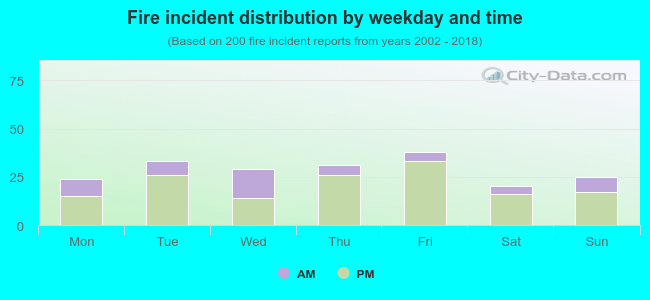 26.5% incidents where reported in the morning and 73.5% in the evening. The most fires (19.0%) took place on Friday, and the least (10.0%) on Saturday.
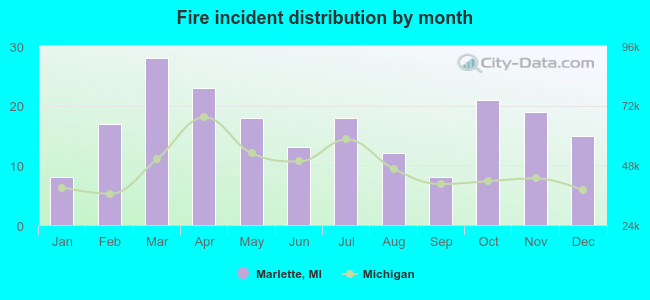 Based on the 200 reports from years 2002 - 2018 most fires (14.0%) took place during March, and the least (4.0%) in January.
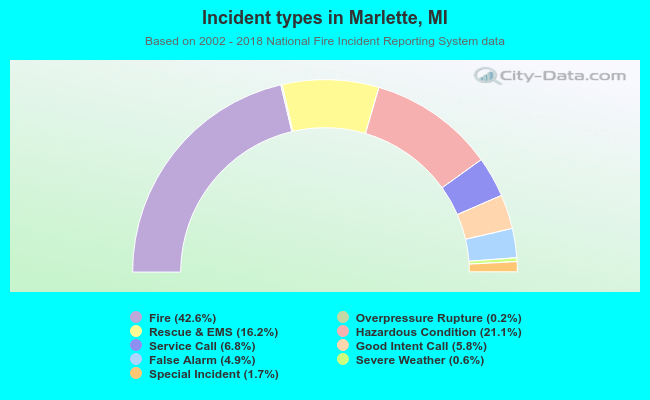 Out of all 469 cases reported during the years 2002 - 2018, the most belonged to the categories: Fire (42.6%), Hazardous Condition (21.1%), and Rescue & EMS (16.2%).
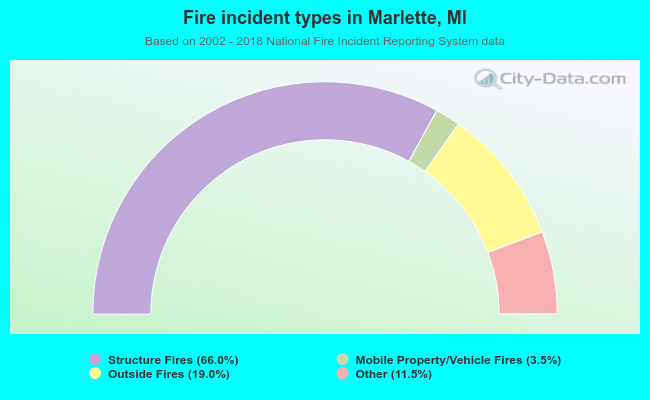 When looking into fire subcategories, the most incidents belonged to: Structure Fires (66.0%), and Outside Fires (19.0%).