| Fire incidents reported |
|---|
| Sreet name | Count |
|---|
| MAIN ST | 32 | | MCCLELLANDTOWN RD | 24 | | RIVER AVE | 12 | | WASHINGTON ST | 12 | | CHURCH AVE | 10 | | MACK FARM RD | 10 | | WATER ST | 10 | | BOY SCOUT RD | 8 | | CEDAR ST | 8 | | COTTAGE AVE | 8 | | FAIRVIEW HILL RD | 8 | | SMITHFIELD-MASONTOWN RD | 8 | | COMMERCIAL AVE | 6 | | FIELD ST | 6 | | FORT MASON VILLAGE | 6 | | FORT MASON VLG | 6 | | GRAY AVE | 6 | | GRAY ST | 6 | | HIGH AVE | 6 | | JACOBS CREEK RD | 6 | | LECKRONE MASONTOWN RD | 6 | | LOCUST ST | 6 | | PROVANCE HILL RD | 6 | | SANGSTON AVE | 6 | | SMITHFIELD MASONTOWN RD | 6 |
| | | Fire incidents reported |
|---|
| Sreet name | Count |
|---|
| SMITHFIELDMASONTOWN RD | 6 | | FISH AND GAME CLUB ROAD | 4 | | HARVEY AVE | 4 | | MAPLE ST | 4 | | NORTH MAIN STREET | 4 | | STAHLS DR | 4 | | 122 N WASHINGTON ST | 2 | | 130 MAC FARM RD. | 2 | | 136 POTPROCKY ASHBY FORD RD | 2 | | 146 VIRGINIA AVE | 2 | | 169 VARSITY DR. | 2 | | 2 E CROSS AVE | 2 | | 217 COLONIAL DR. | 2 | | 217 COLONIAL DRIVE | 2 | | 232 SMITHFIELD RD | 2 | | 300 FISH AND GAME CLUB ROAD | 2 | | 309 S MAIN ST | 2 | | 314 SOUTH MAIN STREET | 2 | | 315 HIGH AVE | 2 | | 3RD ST | 2 | | 4TH STREET | 2 | | 5 S MAIN ST | 2 | | 5 SOUTH WALNUT ST. | 2 | | 58 FORT MASON VLG | 2 | | |
|
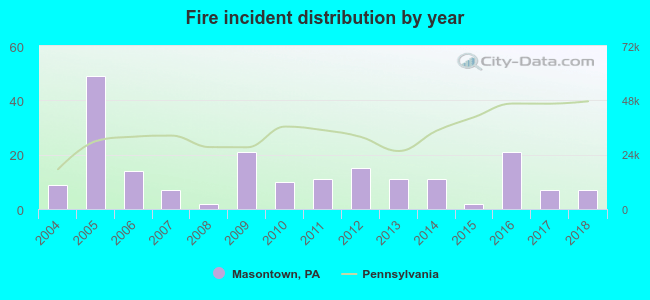 According to the data from the years 2004 - 2018 the average number of fires per year is 13. The highest number of reported fires - 49 took place in 2005, and the least - 2 in 2008. The data has a declining trend.
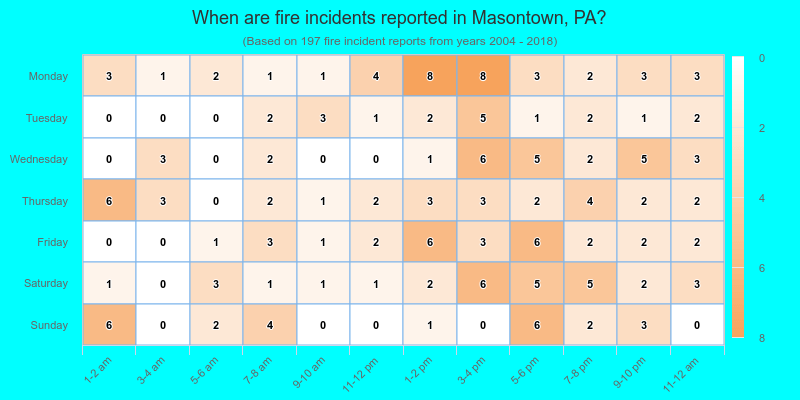
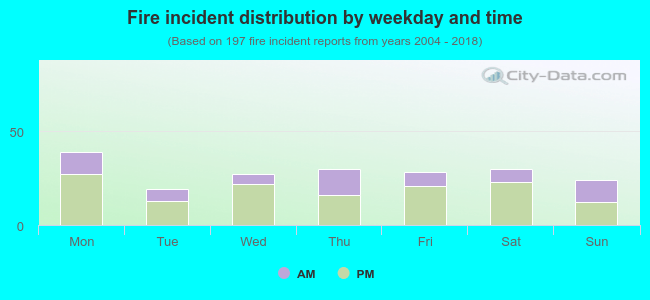 32.0% incidents where reported in the morning and 68.0% in the evening. The most fires (19.8%) took place on Monday, and the least (9.6%) on Tuesday.
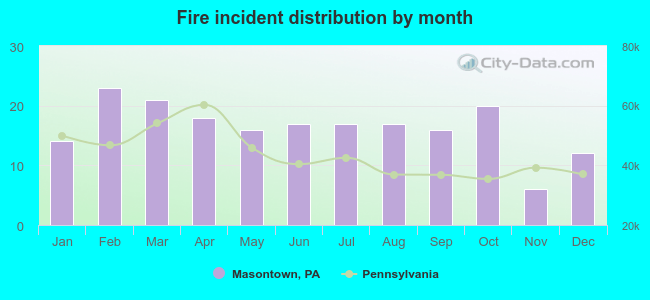 Based on the 197 fire incidents from years 2004 - 2018 most fires (11.7%) took place during February, and the least (3.0%) in November.
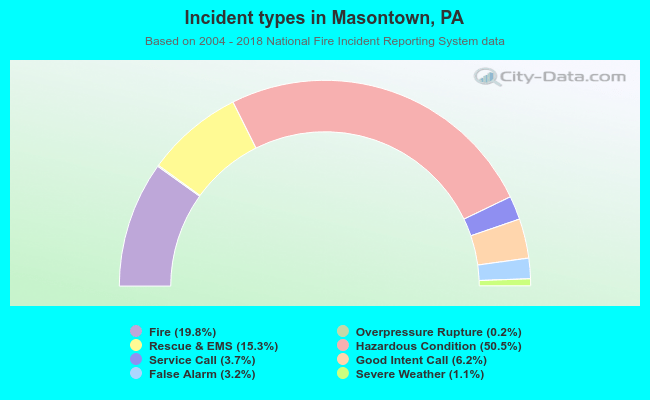 Out of all 996 cases reported during the years 2004 - 2018, the most belonged to the categories: Hazardous Condition (50.5%), Fire (19.8%), and Rescue & EMS (15.3%).
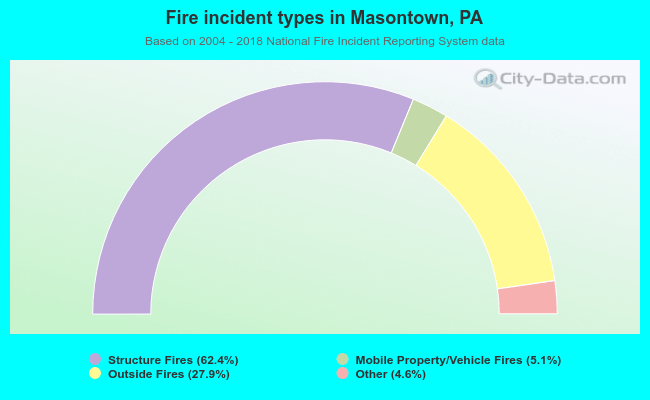 When looking into fire subcategories, the most reports belonged to: Structure Fires (62.4%), and Outside Fires (27.9%).