Mathis: Fire Incidents, Texas (TX)
Where are fire incidents reported in Mathis, TX
Something went wrong! Please refresh the page.
|
| |||||||||||||||||||||||||||||||||||||||||||||||||||||||||||||||||||||||||||||||||||||||||||||||||||||||||||||
| Other | 9 | |||||||||||||||||||||||||||||||||||||||||||||||||||||||||||||||||||||||||||||||||||||||||||||||||||||||||||||
2006 - 2018 National Fire Incident Reporting System (NFIRS) incidents
- Incident types reported to NFIRS in Mathis, TX
- 15158.8%Fire
- 9737.7%Hazardous Condition
- 31.2%Rescue & EMS
- 31.2%Service Call
- 31.2%Good Intent Call
- Fire incident types reported to NFIRS in Mathis, TX
- 10066.2%Outside Fires
- 4127.2%Structure Fires
- 64.0%Other
- 42.6%Mobile Property/Vehicle Fires
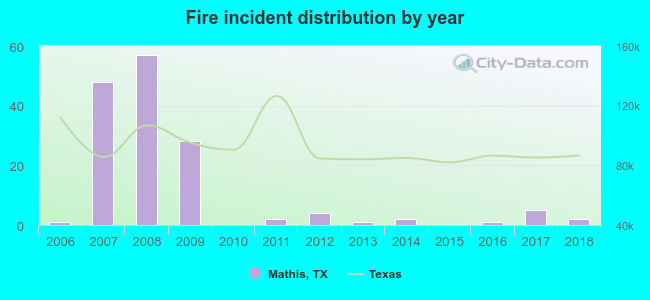 According to the data from the years 2006 - 2018 the average number of fires per year is 12. The highest number of reported fire incidents - 57 took place in 2008, and the least - 0 in 2010. The data has a rising trend.
The average number of yearly fire incidents per 10k residents in Mathis, TX compared to nearest cities:
(Note: Based on data for the last 3 years, including only cities with population 5,000 and above)
| Mathis: | 5.3 |
| Sinton: | 18.6 |
| Robstown: | 106.1 |
| Alice: | 50.7 |
| Portland: | 26.2 |
| Corpus Christi: | 38.5 |
| Kingsville: | 32.0 |
| Ingleside: | 59.1 |
| Aransas Pass: | 93.0 |
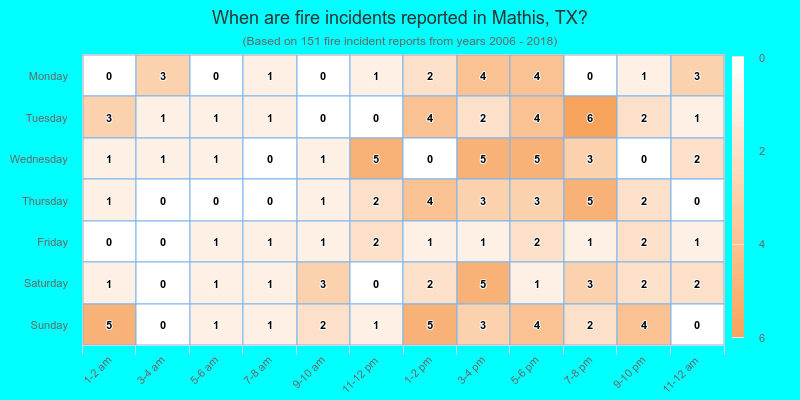
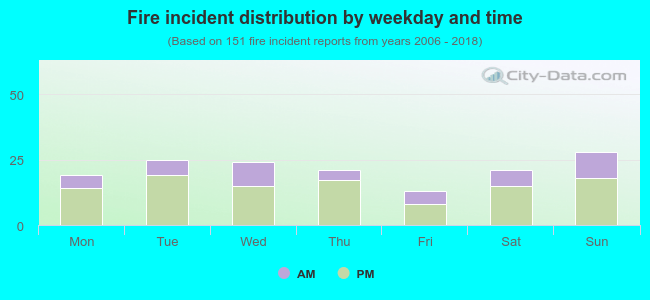 29.8% incidents where reported in the morning and 70.2% in the evening. The most fires (18.5%) took place on Sunday, and the least (8.6%) on Friday.
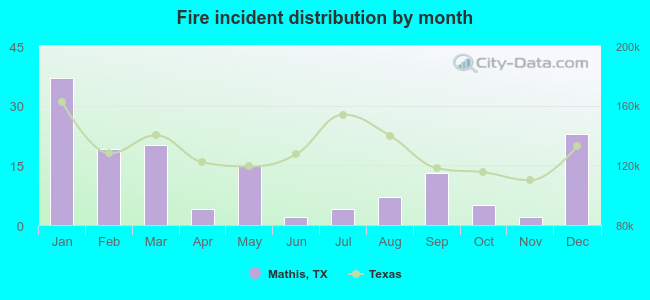 According to the 151 fire incident reports from years 2006 - 2018 most fires (24.5%) took place during January, and the least (1.3%) in June.
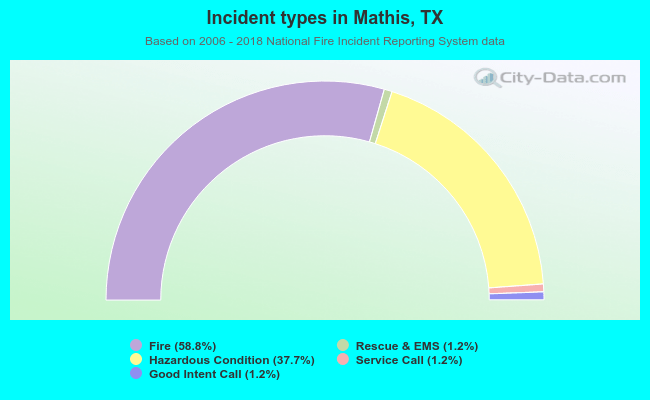 Out of all 257 cases reported during the years 2006 - 2018, the most belonged to the categories: Fire (58.8%), Rescue & EMS (37.7%), and Overpressure Rupture (1.2%).
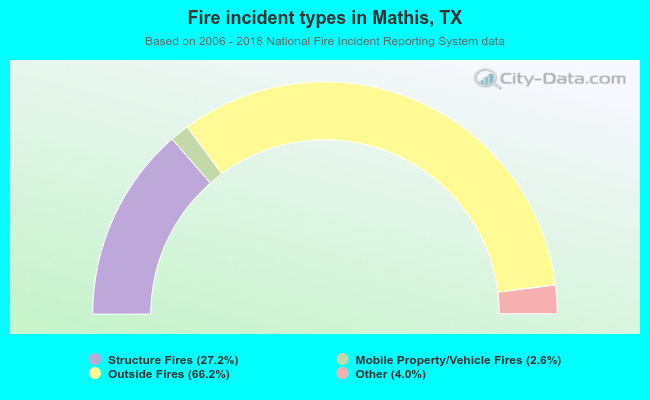 When looking into fire subcategories, the most incidents belonged to: Outside Fires (66.2%), and Structure Fires (27.2%).