| Fire incidents reported |
|---|
| Sreet name | Count |
|---|
| DAY RD | 12 | | LITTLE VALLEY RD | 12 | | DAY RD | 8 | | MCARTHUR RD | 8 | | A ST | 6 | | CIRCLE OAKS DR | 6 | | 44614 HIGHWAY 299 E | 4 | | 62 DAY STAR RD | 4 | | A STREET | 4 | | DEE KNOCK RD | 4 | | HIGHWAY 299 E | 4 | | HIGHWAY 299 HWY | 4 | | HIGHWAY 299E | 4 | | IRIS RD | 4 | | IRIS RD | 4 | | MCARTHUR RD | 4 | | PINE SHADOWS RD | 4 | | "A" ST | 2 | | 1190 DAY RD | 2 | | 178 SCHMEIDER RANCH RD | 2 | | 24681 PITTVILLE-TOLLEN RD | 2 | | 25063 REYNOLDS RD | 2 | | 25800 CIRCLE BELL DR | 2 | | 26452 MAIN ST | 2 | | 26839 PITTVILLE-TOTEN RD | 2 |
| | | Fire incidents reported |
|---|
| Sreet name | Count |
|---|
| 26953 LEE RANCH RD | 2 | | 27226 PITTVILLE-TOTTEN RD | 2 | | 29120 SPENCER LN | 2 | | 321 GOOCH LN | 2 | | 37 DAY | 2 | | 43097 HIGHWAY 299 E | 2 | | 43287 HIGHWAY 299 E | 2 | | 43425 HIGHWAY 299E | 2 | | 43524 HIGHWAY 299 E | 2 | | 43709 DEE KNOCH RD | 2 | | 43825 299 E | 2 | | 44130 HIGHWAY 299 E | 2 | | 44161 "A" ST | 2 | | 44161 A ST. | 2 | | 44198A ST | 2 | | 44215 WALNUT ST | 2 | | 44219 HIGHWAY 299 E | 2 | | 44352 HIGHWAY 299 E | 2 | | 44380 BRUCE CRUM RD | 2 | | 44532 JIM DAY RD | 2 | | 44599 DEE KNOCK RD | 2 | | 44902 | 2 | | 44902 PINE SHADOWS RD | 2 | | 44921 PINE SHADOW RD | 2 | | |
|
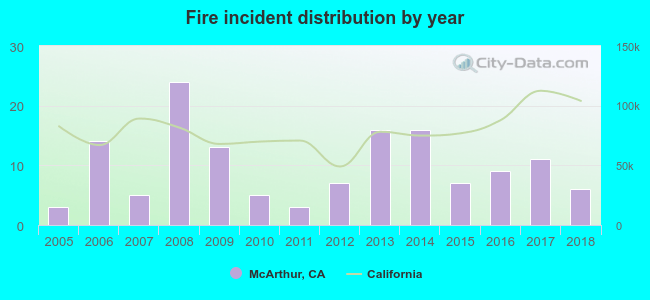 Based on the data from the years 2005 - 2018 the average number of fires per year is 10. The highest number of fires - 24 took place in 2008, and the least - 3 in 2005. The data has a rising trend.
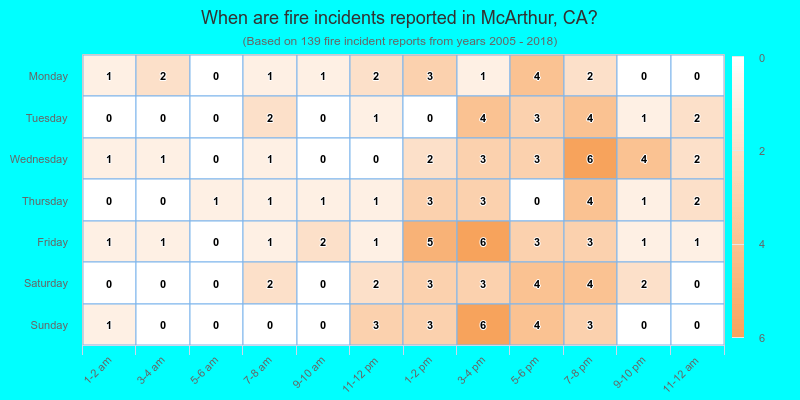
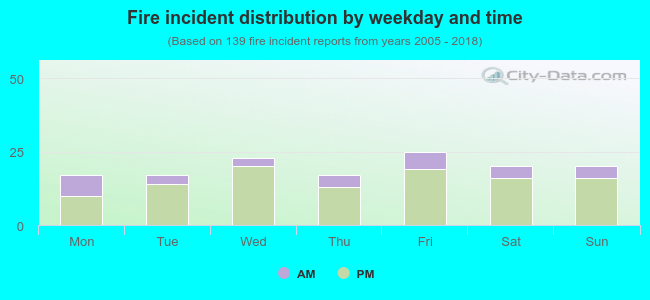 22.3% incidents where reported in the morning and 77.7% in the evening. The most fires (18.0%) took place on Friday, and the least (12.2%) on Monday.
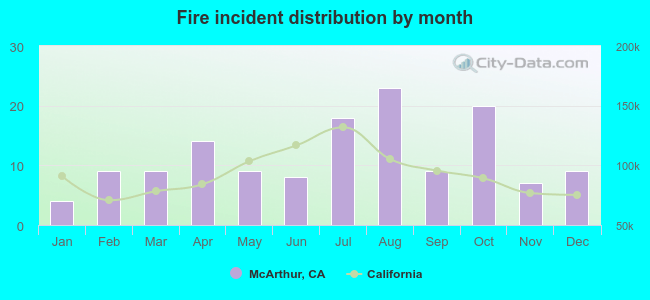 Based on the 139 fire incident reports from years 2005 - 2018 most fires (16.5%) took place during August, and the least (2.9%) in January.
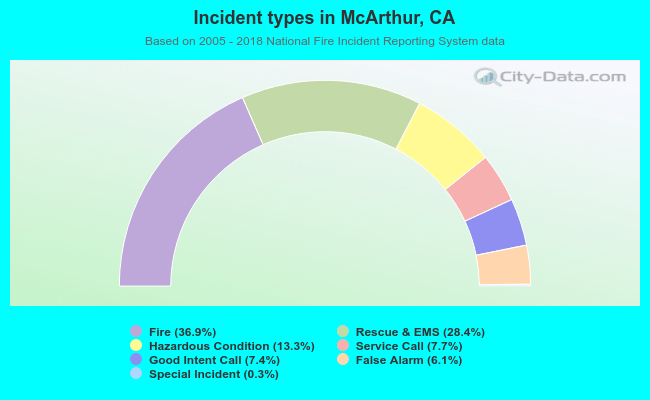 Out of all 377 cases reported during the years 2005 - 2018, the most belonged to the categories: Fire (36.9%), Overpressure Rupture (28.4%), and Rescue & EMS (13.3%).
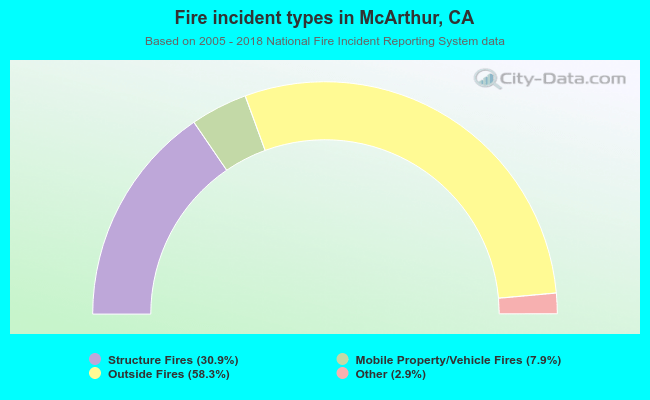 When looking into fire subcategories, the most incidents belonged to: Outside Fires (58.3%), and Structure Fires (30.9%).