Midfield: Fire Incidents, Alabama (AL)
Where are fire incidents reported in Midfield, AL
Something went wrong! Please refresh the page.
|
| |||||||||||||||||||||||||||||||||||||||||||||||||||||||||||||||||||||||||||||||||||||||||||||||||||||||||||||
2005 - 2018 National Fire Incident Reporting System (NFIRS) incidents
- Incident types reported to NFIRS in Midfield, AL
- 2,18257.8%Rescue & EMS
- 56114.9%Fire
- 3639.6%Service Call
- 3489.2%Good Intent Call
- 2035.4%Hazardous Condition
- 1102.9%False Alarm
- 70.2%Overpressure Rupture
- Fire incident types reported to NFIRS in Midfield, AL
- 28250.3%Structure Fires
- 16329.1%Mobile Property/Vehicle Fires
- 10518.7%Outside Fires
- 112.0%Other
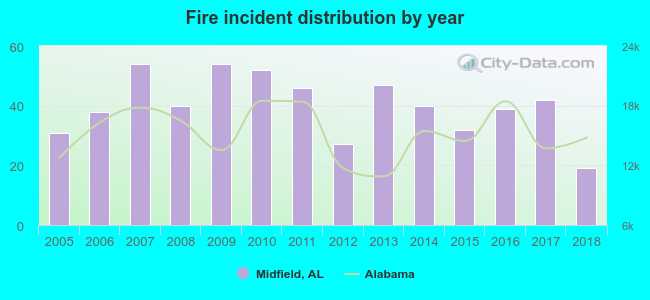 According to the data from the years 2005 - 2018 the average number of fire incidents per year is 40. The highest number of reported fires - 54 took place in 2007, and the least - 19 in 2018. The data has a decreasing trend.
The average number of yearly fire incidents per 10k residents in Midfield, AL compared to nearest cities:
(Note: Based on data for the last 3 years, including only cities with population 5,000 and above)
| Midfield: | 63.3 |
| Fairfield: | 8.2 |
| Pleasant Grove: | 30.3 |
| Hueytown: | 27.8 |
| Bessemer: | 92.8 |
| Homewood: | 35.3 |
| Birmingham: | 87.0 |
| Hoover: | 8.0 |
| Vestavia Hills: | 20.2 |
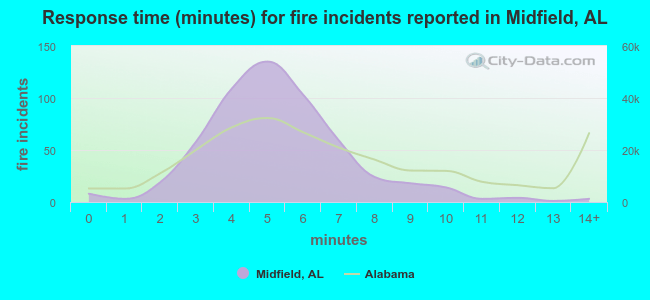 The median response time based on all reported fire incidents is 5 minutes. This is lower compared to the Alabama median value.
The median response time in Midfield, AL compared to nearest cities:
(Note: Based on data for all years, including only cities with at least 500 fire incidents)
| Midfield: | 5 minutes |
| Pleasant Grove: | 4 minutes |
| Bessemer: | 5 minutes |
| Homewood: | 6 minutes |
| Birmingham: | 6 minutes |
| Hoover: | 5 minutes |
| Vestavia Hills: | 4 minutes |
| Adamsville: | 5 minutes |
| Tarrant: | 3 minutes |
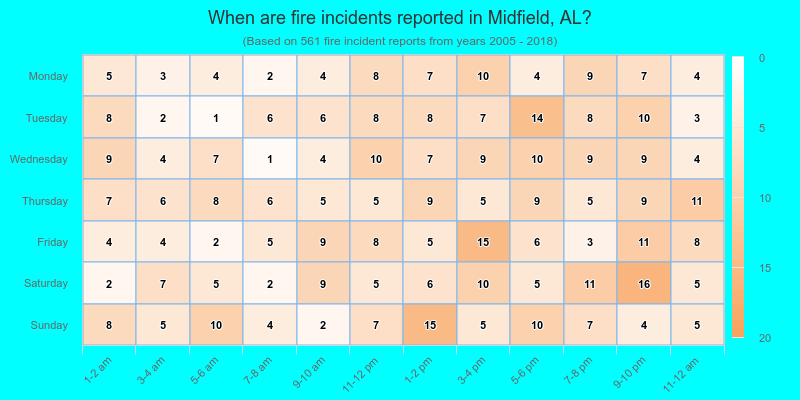
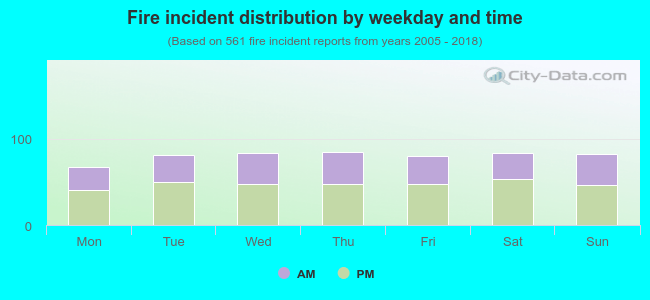 40.5% incidents where reported in the morning and 59.5% in the evening. The most fires (15.2%) took place on Thursday, and the least (11.9%) on Monday.
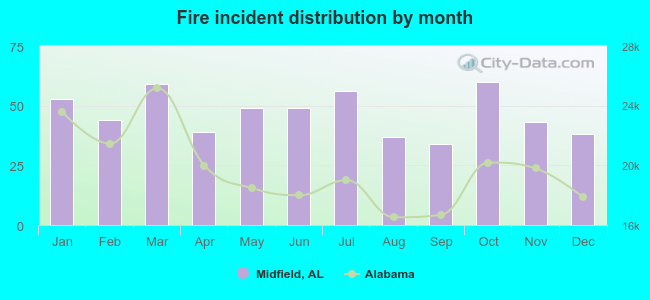 According to the 561 incident reports from years 2005 - 2018 most fires (10.7%) took place during October, and the least (6.1%) in September.
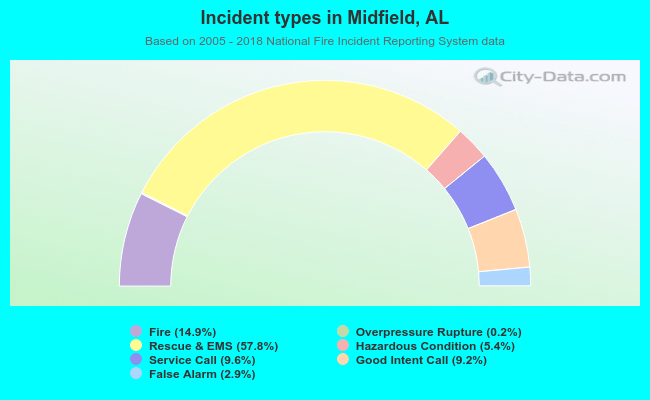 Out of all 3,774 cases reported during the years 2005 - 2018, the most belonged to the categories: Rescue & EMS (57.8%), Fire (14.9%), and Service Call (9.6%).
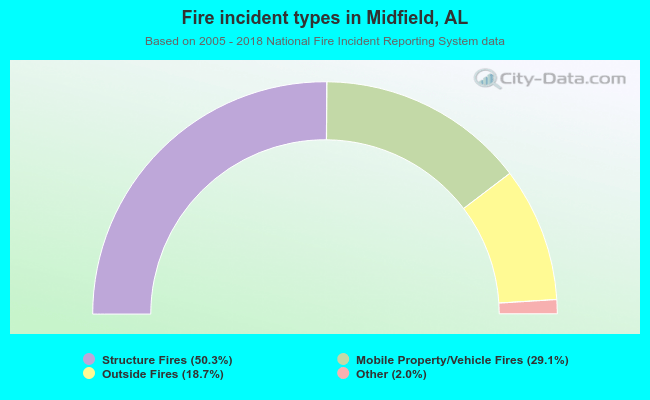 When looking into fire subcategories, the most reports belonged to: Structure Fires (50.3%), and Mobile Property/Vehicle Fires (29.1%).