Milledgeville: Fire Incidents, Georgia (GA)
Where are fire incidents reported in Milledgeville, GA
Something went wrong! Please refresh the page.
| Fire incidents reported | |
|---|---|
| Sreet name | Count |
| COLUMBIA ST | 244 |
| COLUMBIA ST. | 110 |
| VINSON HWY | 106 |
| JEFFERSON ST | 98 |
| ALLEN MEMORIAL DR | 92 |
| IRWINTON RD | 90 |
| HIGHWAY 49 | 82 |
| HARRISBURG RD | 76 |
| GORDON HWY | 74 |
| SPARTA HWY | 74 |
| HIGHWAY 22 | 56 |
| WAYNE ST | 56 |
| STEMBRIDGE RD | 54 |
| IVEY DR | 52 |
| MAIN ST | 52 |
| LAKE LAUREL RD | 50 |
| KINGS RD | 46 |
| OLD MONTICELLO RD | 46 |
| JEFFERSON ST. | 44 |
| OLD STAGE DR | 44 |
| HIGHWAY 24 | 40 |
| PANCRAS RD | 40 |
| MERIWETHER RD | 38 |
| LOG CABIN RD | 36 |
| ROBERSON MILL RD | 36 |
| ANTHONY WAY | 34 |
| WILKINSON ST | 34 |
| COLONY FARM RD | 32 |
| HIGHWAY 212 | 32 |
| GRANDVIEW DR | 30 |
| Other | 1,286 |
2003 - 2018 National Fire Incident Reporting System (NFIRS) incidents
- Incident types reported to NFIRS in Milledgeville, GA
- 8,10648.6%Rescue & EMS
- 3,18419.1%Fire
- 1,6279.8%False Alarm
- 1,5029.0%Good Intent Call
- 1,2677.6%Hazardous Condition
- 8745.2%Service Call
- 480.3%Overpressure Rupture
- 380.2%Special Incident
- 250.1%Severe Weather
- Fire incident types reported to NFIRS in Milledgeville, GA
- 1,37543.2%Outside Fires
- 1,17236.8%Structure Fires
- 52816.6%Mobile Property/Vehicle Fires
- 1093.4%Other
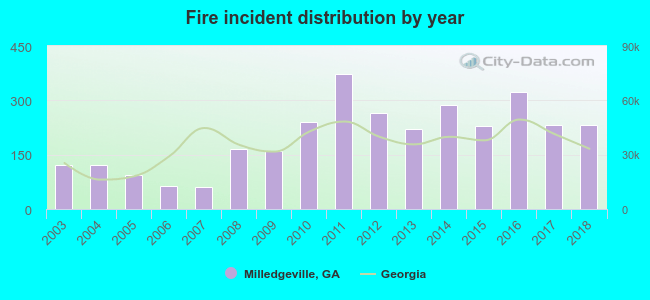 Based on the data from the years 2003 - 2018 the average number of fire incidents per year is 199. The highest number of reported fire incidents - 372 took place in 2011, and the least - 62 in 2007. The data has an increasing trend.
The average number of yearly fire incidents per 10k residents in Milledgeville, GA compared to nearest cities:
(Note: Based on data for the last 3 years, including only cities with population 5,000 and above)
| Milledgeville: | 136.4 |
| Eatonton: | 187.1 |
| Sandersville: | 128.6 |
| Macon: | 117.8 |
| Lizella: | 21.5 |
| Warner Robins: | 45.5 |
| Centerville: | 42.2 |
| Dublin: | 145.0 |
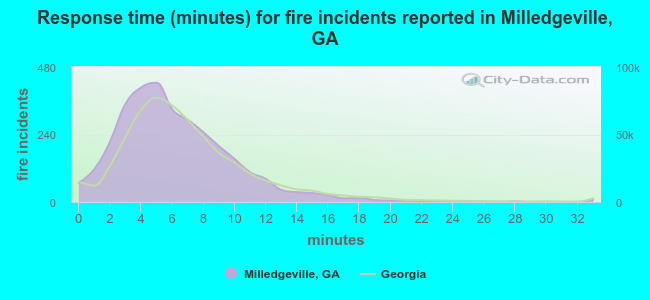 The median response time based on all reported fire incidents is 6 minutes. This is close to the state median value.
The median response time in Milledgeville, GA compared to nearest cities:
(Note: Based on data for all years, including only cities with at least 500 fire incidents)
| Milledgeville: | 6 minutes |
| Gray: | 6 minutes |
| Eatonton: | 7 minutes |
| Sandersville: | 4 minutes |
| Macon: | 4 minutes |
| Madison: | 9 minutes |
| Wrightsville: | 10 minutes |
| Warrenton: | 12 minutes |
| Warner Robins: | 6 minutes |
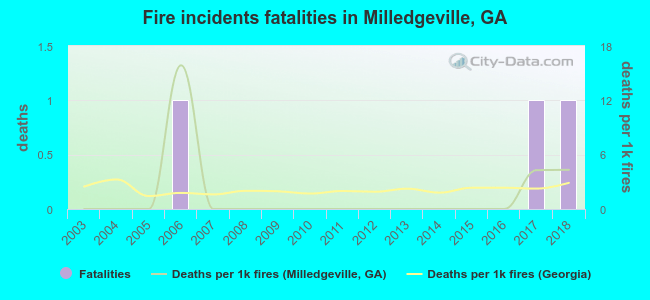 Based on the reports from the years 2003 - 2018 the average number of fire-related yearly deaths is 0. The highest number of reported deaths - 1 took place in 2006, and the lowest - 0 in 2003. The data has an increasing trend.
The average number of fatalities per 1,000 fire incidents is 2. This indicator was the highest - 16 in 2006, and the lowest 0 in 2003. The trend for fatalities per 1,000 incidents is rising. Compared to the Georgia value the number of deaths per 1,000 fire incidents is much lower.
Based on the reports from the years 2003 - 2018 the average number of fire-related yearly deaths is 0. The highest number of reported deaths - 1 took place in 2006, and the lowest - 0 in 2003. The data has an increasing trend.
The average number of fatalities per 1,000 fire incidents is 2. This indicator was the highest - 16 in 2006, and the lowest 0 in 2003. The trend for fatalities per 1,000 incidents is rising. Compared to the Georgia value the number of deaths per 1,000 fire incidents is much lower.Deaths per 1,000 incidents in Milledgeville, GA compared to nearest cities:
(Note: Based on data for all years, including only cities with at least 2,500 fire incidents)
| Milledgeville: | 0.9 |
| Macon: | 1.6 |
| Warner Robins: | 1.4 |
| Jackson: | 0.8 |
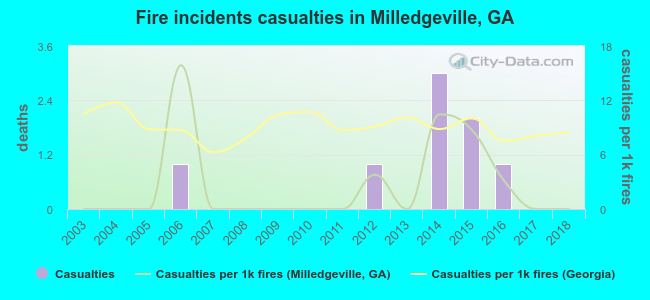 Based on the data from the years 2003 - 2018 the average number of fire-related yearly casualties is 1. The highest number of reported casualties - 3 took place in 2014, and the lowest - 0 in 2003. The data has a constant trend.
The average number of injuries per 1,000 fires is 3. This indicator was the highest - 16 in 2006, and the lowest 0 in 2003. The trend for casualties per 1,000 incidents is rising. Compared to the state value the number of casualties per 1,000 fires is much lower.
Based on the data from the years 2003 - 2018 the average number of fire-related yearly casualties is 1. The highest number of reported casualties - 3 took place in 2014, and the lowest - 0 in 2003. The data has a constant trend.
The average number of injuries per 1,000 fires is 3. This indicator was the highest - 16 in 2006, and the lowest 0 in 2003. The trend for casualties per 1,000 incidents is rising. Compared to the state value the number of casualties per 1,000 fires is much lower.Casualties per 1,000 incidents in Milledgeville, GA compared to nearest cities:
(Note: Based on data for all years, including only cities with at least 500 fire incidents)
| Milledgeville: | 2.5 |
| Gray: | 12.1 |
| Eatonton: | 0.9 |
| Sandersville: | 4.4 |
| Macon: | 2.5 |
| Madison: | 2.4 |
| Wrightsville: | 3.8 |
| Warrenton: | 9.1 |
| Warner Robins: | 18.1 |
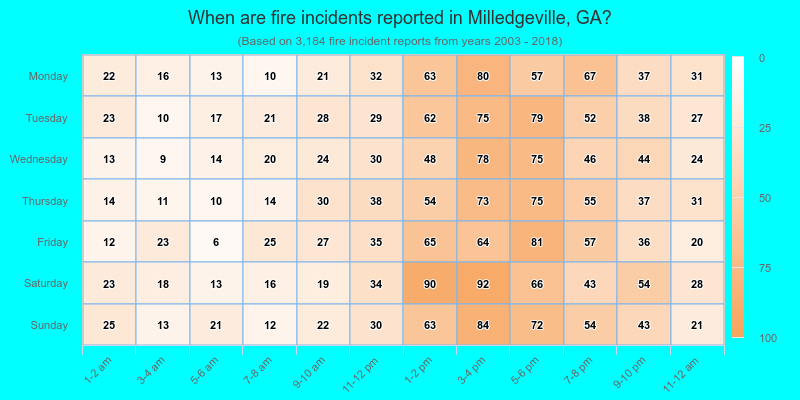
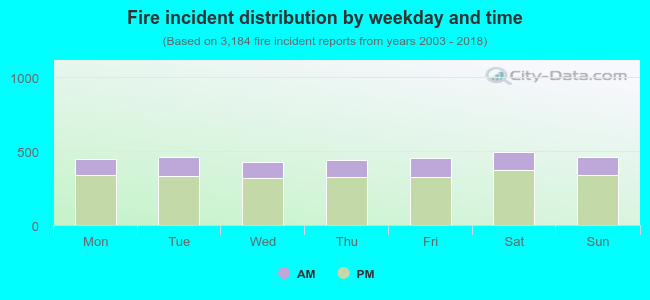 26.5% incidents where reported in the morning and 73.5% in the evening. The most fires (15.6%) took place on Saturday, and the least (13.3%) on Wednesday.
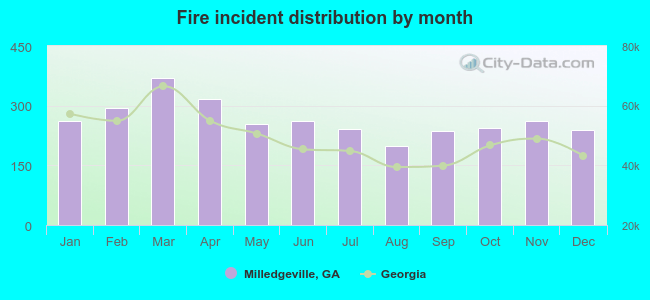 Based on the 3,184 fire incidents from years 2003 - 2018 most fires (11.6%) took place during March, and the least (6.3%) in August.
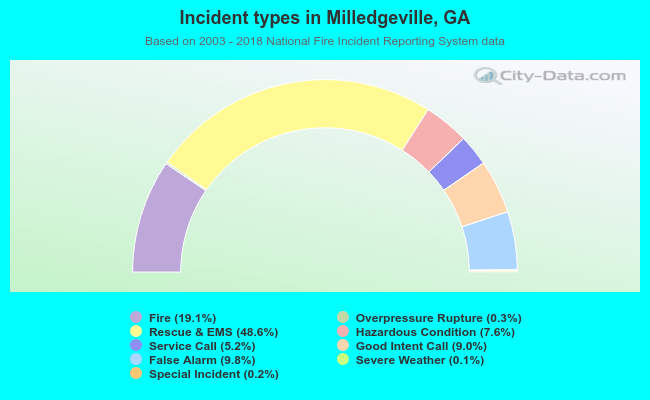 Out of all 16,671 cases reported during the years 2003 - 2018, the most belonged to the categories: Rescue & EMS (48.6%), Fire (19.1%), and False Alarm (9.8%).
 When looking into fire subcategories, the most incidents belonged to: Outside Fires (43.2%), and Structure Fires (36.8%).