Mingo: Fire Incidents, Iowa (IA)
Where are fire incidents reported in Mingo, IA
Something went wrong! Please refresh the page.
|
| |||||||||||||||||||||||||||||||||||||||||||||||||||||||||||||||||||||||||||||||||||||||||||||||||||||||||||||
2002 - 2018 National Fire Incident Reporting System (NFIRS) incidents
- Incident types reported to NFIRS in Mingo, IA
- 13344.6%Fire
- 12140.6%Rescue & EMS
- 175.7%Good Intent Call
- 144.7%False Alarm
- 103.4%Hazardous Condition
- 20.7%Special Incident
- 10.3%Service Call
- Fire incident types reported to NFIRS in Mingo, IA
- 6851.1%Outside Fires
- 3627.1%Structure Fires
- 1813.5%Mobile Property/Vehicle Fires
- 118.3%Other
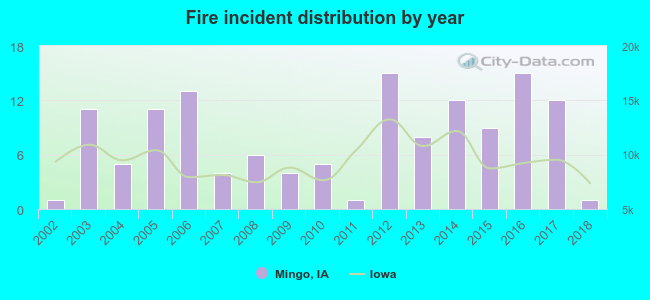 Based on the data from the years 2002 - 2018 the average number of fires per year is 8. The highest number of fire incidents - 15 took place in 2012, and the least - 1 in 2002. The data has a constant trend.
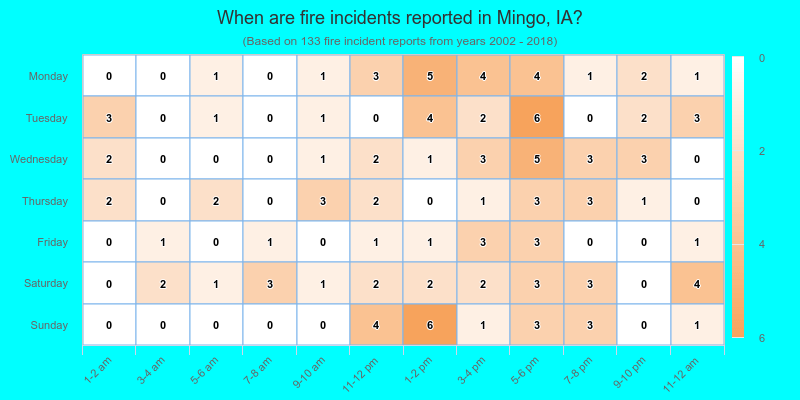
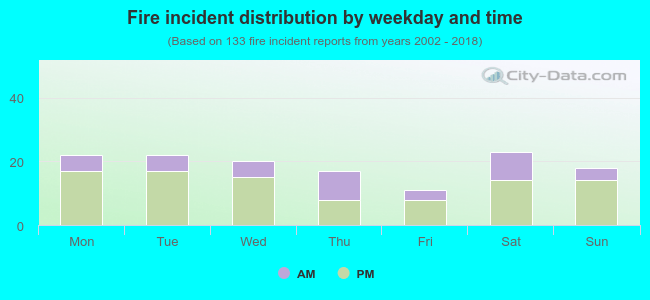 30.1% incidents where reported in the morning and 69.9% in the evening. The most fires (17.3%) took place on Saturday, and the least (8.3%) on Friday.
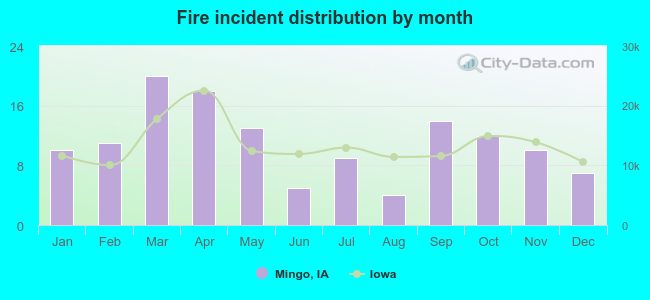 Based on the 133 fire incident reports from years 2002 - 2018 most fires (15.0%) took place during March, and the least (3.0%) in August.
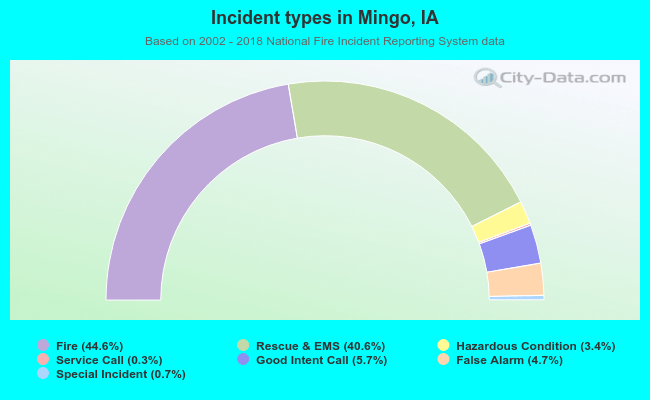 Out of all 298 cases reported during the years 2002 - 2018, the most belonged to the categories: Fire (44.6%), Overpressure Rupture (40.6%), and Service Call (5.7%).
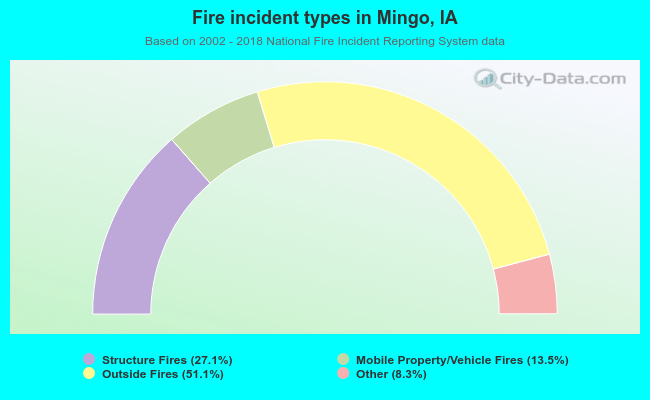 When looking into fire subcategories, the most incidents belonged to: Outside Fires (51.1%), and Structure Fires (27.1%).