Monahans: Fire Incidents, Texas (TX)
Where are fire incidents reported in Monahans, TX
Something went wrong! Please refresh the page.
|
| |||||||||||||||||||||||||||||||||||||||||||||||||||||||||||||||||||||||||||||||||||||||||||||||||||||||||||||
2003 - 2016 National Fire Incident Reporting System (NFIRS) incidents
- Incident types reported to NFIRS in Monahans, TX
- 63589.6%Fire
- 243.4%Good Intent Call
- 233.2%Rescue & EMS
- 172.4%Hazardous Condition
- 91.3%Service Call
- 10.1%Special Incident
- Fire incident types reported to NFIRS in Monahans, TX
- 42667.1%Outside Fires
- 11317.8%Mobile Property/Vehicle Fires
- 609.4%Structure Fires
- 365.7%Other
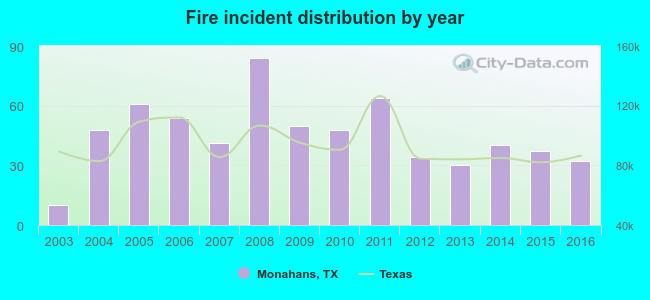 Based on the data from the years 2003 - 2016 the average number of fire incidents per year is 45. The highest number of fires - 84 took place in 2008, and the least - 10 in 2003. The data has a growing trend.
The average number of yearly fire incidents per 10k residents in Monahans, TX compared to nearest cities:
(Note: Based on data for the last 3 years, including only cities with population 5,000 and above)
| Monahans: | 22.3 |
| West Odessa: | 36.0 |
| Odessa: | 55.7 |
| Fort Stockton: | 9.4 |
| Andrews: | 141.4 |
| Midland: | 23.6 |
| Seminole: | 2.8 |
| Big Spring: | 67.3 |
| Alpine: | 1.7 |
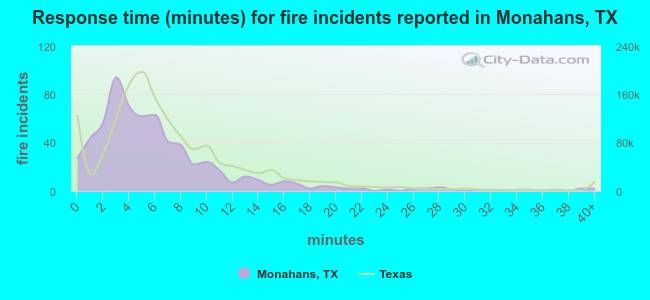 The median response time based on all reported fire incidents is 5 minutes. This is lower than the state median value.
The median response time in Monahans, TX compared to nearest cities:
(Note: Based on data for all years, including only cities with at least 500 fire incidents)
| Monahans: | 5 minutes |
| Odessa: | 6 minutes |
| Jal: | 15 minutes |
| Andrews: | 13 minutes |
| Midland: | 6 minutes |
| Eunice: | 11 minutes |
| Hobbs: | 5 minutes |
| Denver City: | 6 minutes |
| Big Spring: | 7 minutes |
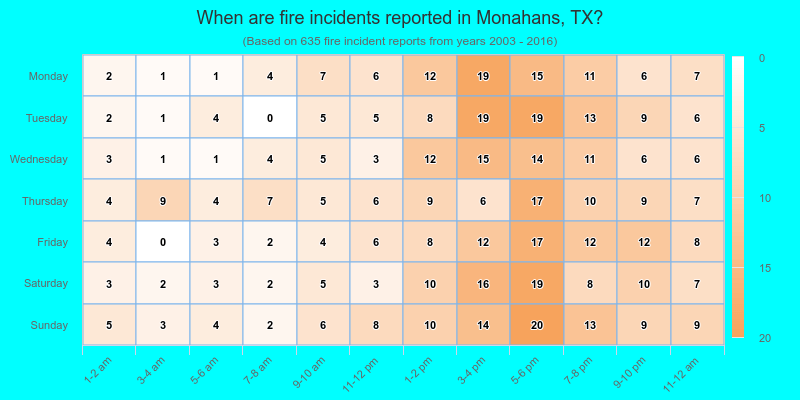
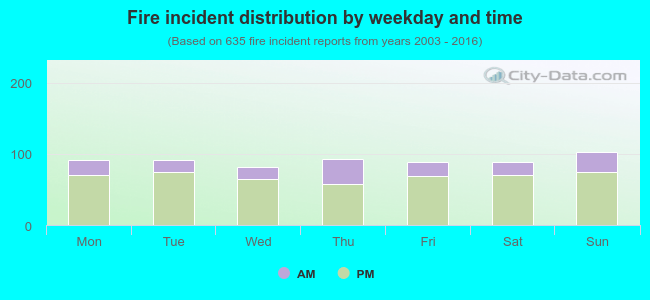 24.4% incidents where reported in the morning and 75.6% in the evening. The most fires (16.2%) took place on Sunday, and the least (12.8%) on Wednesday.
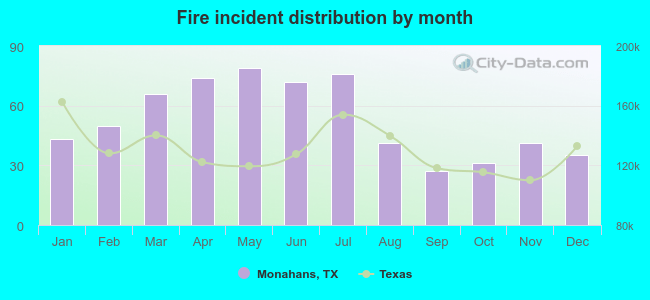 According to the 635 fire incident reports from years 2003 - 2016 most fires (12.4%) took place during May, and the least (4.3%) in September.
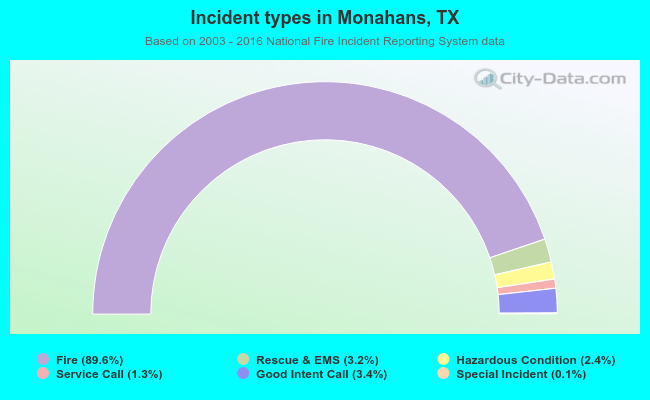 Out of all 709 cases reported during the years 2003 - 2016, the most belonged to the categories: Fire (89.6%), Service Call (3.4%), and Overpressure Rupture (3.2%).
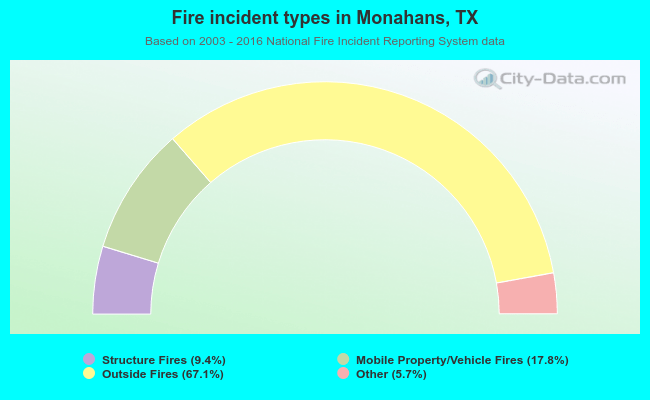 When looking into fire subcategories, the most incidents belonged to: Outside Fires (67.1%), and Mobile Property/Vehicle Fires (17.8%).