Morgan Hill: Fire Incidents, California (CA)
Where are fire incidents reported in Morgan Hill, CA
Something went wrong! Please refresh the page.
| Fire incidents reported | |
|---|---|
| Sreet name | Count |
| FY 101 | 150 |
| BUTTERFIELD BL | 136 |
| MONTEREY HY | 128 |
| DUNNE AV | 118 |
| MAIN AV | 88 |
| COCHRANE RD | 46 |
| CONDIT RD | 38 |
| DUNNE AVE | 38 |
| HALE AV | 36 |
| DEL MONTE AV | 30 |
| CENTRAL AV | 26 |
| UVAS RD | 26 |
| BUTTERFIELD | 24 |
| BURNETT AV | 22 |
| JARVIS DR | 22 |
| 101 HWY | 20 |
| DOUGHERTY AV | 20 |
| MONTEREY RD | 20 |
| OAK GLEN AV | 20 |
| SAN BRUNO AV | 20 |
| TENNANT AV | 20 |
| COYOTE RD | 18 |
| DIANA AV | 18 |
| EDMUNDSON AV | 16 |
| SAN PEDRO AV | 16 |
| SORREL WY | 16 |
| WATSONVILLE RD | 16 |
| HOLIDAY DR | 14 |
| LLAGAS RD | 14 |
| MURPHY AV | 14 |
2005 - 2018 National Fire Incident Reporting System (NFIRS) incidents
- Incident types reported to NFIRS in Morgan Hill, CA
- 1,12337.6%Fire
- 87329.2%Rescue & EMS
- 43314.5%Hazardous Condition
- 2779.3%Good Intent Call
- 1826.1%Service Call
- 943.1%False Alarm
- Fire incident types reported to NFIRS in Morgan Hill, CA
- 55649.5%Outside Fires
- 30627.2%Structure Fires
- 18616.6%Mobile Property/Vehicle Fires
- 756.7%Other
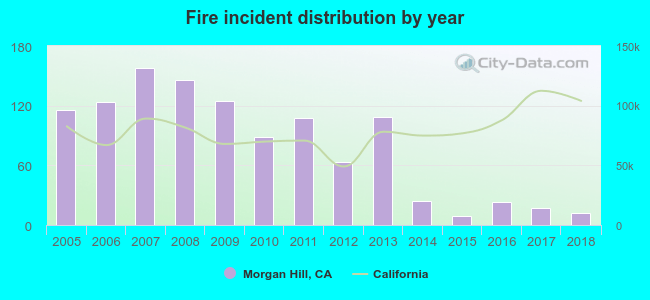 According to the data from the years 2005 - 2018 the average number of fires per year is 80. The highest number of fire incidents - 158 took place in 2007, and the least - 9 in 2015. The data has a declining trend.
The average number of yearly fire incidents per 10k residents in Morgan Hill, CA compared to nearest cities:
(Note: Based on data for the last 3 years, including only cities with population 5,000 and above)
| Morgan Hill: | 4.1 |
| San Martin: | 13.8 |
| Gilroy: | 55.0 |
| Watsonville: | 9.2 |
| San Jose: | 15.6 |
| Aptos: | 38.0 |
| Los Gatos: | 32.2 |
| Soquel: | 20.7 |
| Capitola: | 25.3 |
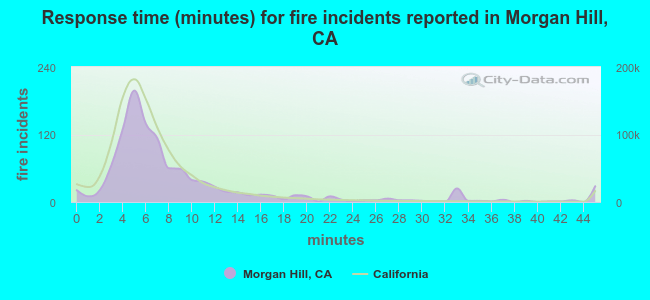 The median response time based on all reported fire incidents is 6 minutes. This is about the same as the California median value.
The median response time in Morgan Hill, CA compared to nearest cities:
(Note: Based on data for all years, including only cities with at least 500 fire incidents)
| Morgan Hill: | 6 minutes |
| Gilroy: | 7 minutes |
| Watsonville: | 11 minutes |
| San Jose: | 6 minutes |
| Aptos: | 7 minutes |
| Los Gatos: | 6 minutes |
| Campbell: | 5 minutes |
| Scotts Valley: | 7 minutes |
| Live Oak: | 6 minutes |
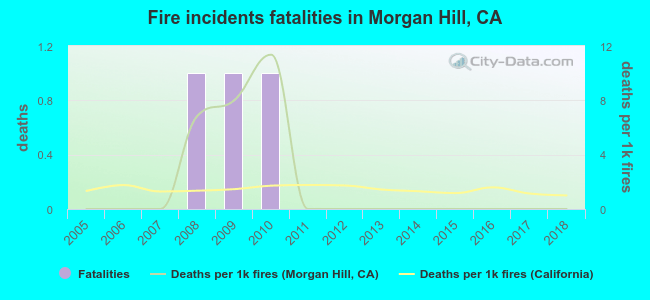 Based on the data from the years 2005 - 2018 the average number of fire-related yearly deaths is 0. The highest number of reported deaths - 1 took place in 2008, and the lowest - 0 in 2005. The data has a constant trend.
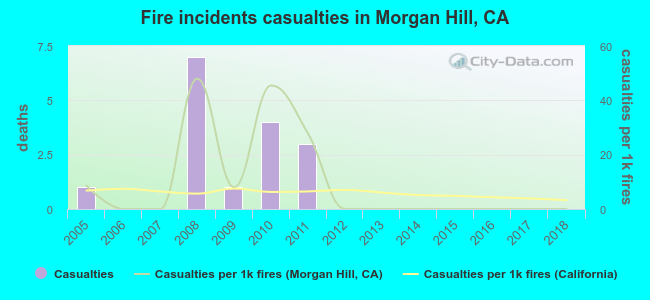 According to the data from the years 2005 - 2018 the average number of fire-related casualties per year is 1. The highest number of reported injuries - 7 took place in 2008, and the lowest - 0 in 2006. The data has a dropping trend.
The average number of injuries per 1,000 fire incidents is 10. This indicator was the highest - 48 in 2008, and the lowest 0 in 2006. The trend for injuries per 1,000 fires is dropping. Compared to the state value the number of injuries per 1,000 incidents is much higher.
According to the data from the years 2005 - 2018 the average number of fire-related casualties per year is 1. The highest number of reported injuries - 7 took place in 2008, and the lowest - 0 in 2006. The data has a dropping trend.
The average number of injuries per 1,000 fire incidents is 10. This indicator was the highest - 48 in 2008, and the lowest 0 in 2006. The trend for injuries per 1,000 fires is dropping. Compared to the state value the number of injuries per 1,000 incidents is much higher.Casualties per 1,000 incidents in Morgan Hill, CA compared to nearest cities:
(Note: Based on data for all years, including only cities with at least 500 fire incidents)
| Morgan Hill: | 14.2 |
| Gilroy: | 7.1 |
| Watsonville: | 2.4 |
| San Jose: | 8.7 |
| Aptos: | 12.8 |
| Los Gatos: | 19.7 |
| Campbell: | 24.7 |
| Scotts Valley: | 7.0 |
| Live Oak: | 9.0 |
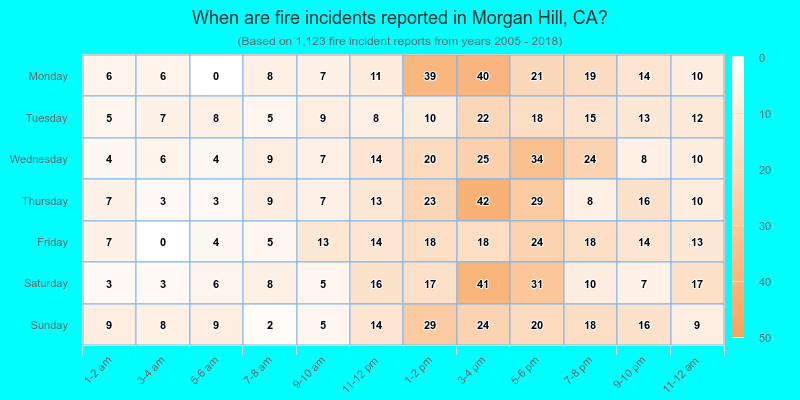
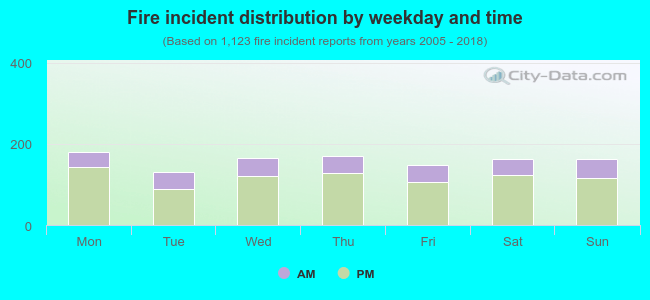 26.4% incidents where reported in the morning and 73.6% in the evening. The most fires (16.1%) took place on Monday, and the least (11.8%) on Tuesday.
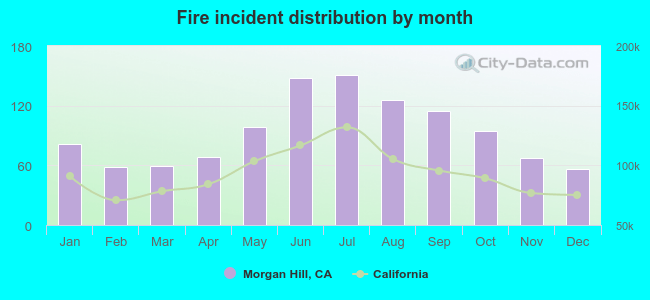 According to the 1,123 reports from years 2005 - 2018 most fires (13.4%) took place during July, and the least (5.0%) in December.
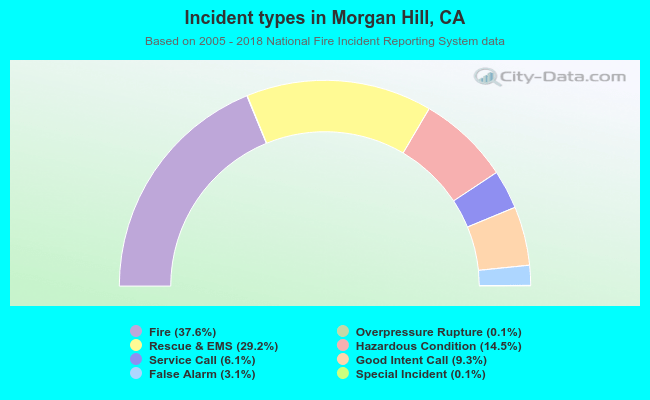 Out of all 2,986 cases reported during the years 2005 - 2018, the most belonged to the categories: Fire (37.6%), Rescue & EMS (29.2%), and Hazardous Condition (14.5%).
 When looking into fire subcategories, the most incidents belonged to: Outside Fires (49.5%), and Structure Fires (27.2%).