Muncie: Fire Incidents, Indiana (IN)
Where are fire incidents reported in Muncie, IN
Something went wrong! Please refresh the page.
| Fire incidents reported | |
|---|---|
| Sreet name | Count |
| JACKSON ST | 310 |
| WALNUT ST | 278 |
| ELM ST | 198 |
| 8TH ST | 180 |
| MEMORIAL DR | 174 |
| MADISON ST | 164 |
| MCGALLIARD RD | 146 |
| MAIN ST | 140 |
| 7TH ST | 128 |
| JEFFERSON ST | 126 |
| 9TH ST | 116 |
| ELGIN ST | 108 |
| MULBERRY ST | 98 |
| CHARLES ST | 92 |
| RIVERSIDE AV | 92 |
| 13TH ST | 84 |
| 18TH ST | 82 |
| BURLINGTON DR | 82 |
| WILLARD ST | 82 |
| KILGORE AV | 80 |
| MORRISON RD | 80 |
| PERSHING DR | 78 |
| 11TH ST | 74 |
| MACEDONIA AV | 74 |
| 10TH ST | 72 |
| 6TH ST | 72 |
| 12TH ST | 70 |
| 16TH ST | 70 |
| 5TH ST | 68 |
| BETHEL AV | 66 |
| Other | 2,444 |
2002 - 2017 National Fire Incident Reporting System (NFIRS) incidents
- Incident types reported to NFIRS in Muncie, IN
- 9,32141.1%Rescue & EMS
- 5,92826.2%Fire
- 3,89417.2%Hazardous Condition
- 1,7937.9%Good Intent Call
- 8453.7%False Alarm
- 7253.2%Service Call
- 1230.5%Special Incident
- Fire incident types reported to NFIRS in Muncie, IN
- 2,68145.2%Outside Fires
- 2,09735.4%Structure Fires
- 76412.9%Mobile Property/Vehicle Fires
- 3866.5%Other
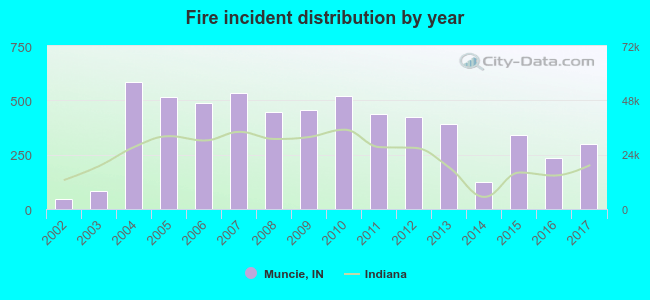 Based on the data from the years 2002 - 2017 the average number of fire incidents per year is 370. The highest number of fires - 586 took place in 2004, and the least - 48 in 2002. The data has a growing trend.
The average number of yearly fire incidents per 10k residents in Muncie, IN compared to nearest cities:
(Note: Based on data for the last 3 years, including only cities with population 5,000 and above)
| Muncie: | 25.5 |
| Yorktown: | 45.2 |
| Alexandria: | 16.4 |
| Anderson: | 8.4 |
| Hartford City: | 21.5 |
| New Castle: | 30.4 |
| Gas City: | 58.0 |
| Elwood: | 24.8 |
| Portland: | 36.0 |
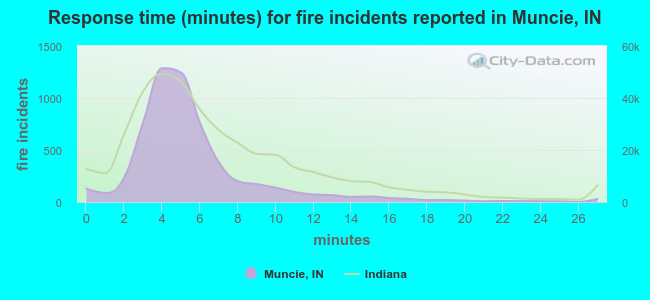 The median response time based on all reported fire incidents is 5 minutes. This is lower than the Indiana median value.
The median response time in Muncie, IN compared to nearest cities:
(Note: Based on data for all years, including only cities with at least 500 fire incidents)
| Muncie: | 5 minutes |
| Yorktown: | 9 minutes |
| Gaston: | 8 minutes |
| Daleville: | 8 minutes |
| Chesterfield: | 8 minutes |
| Middletown: | 6 minutes |
| Alexandria: | 5 minutes |
| Anderson: | 7 minutes |
| Hartford City: | 3 minutes |
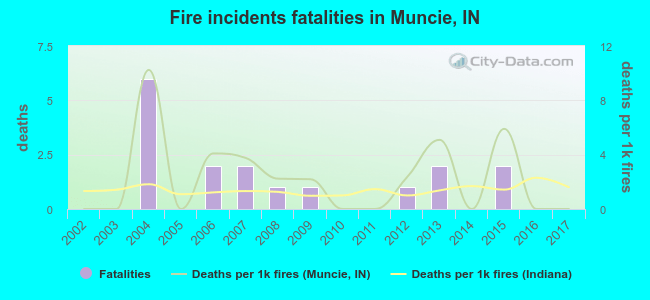 According to the reports from the years 2002 - 2017 the average number of fire-related fatalities per year is 1. The highest number of deaths - 6 took place in 2004, and the lowest - 0 in 2002. The data has a constant trend.
The average number of fatalities per 1,000 fire incidents is 2. This indicator was the highest - 10 in 2004, and the lowest 0 in 2002. The trend for fatalities per 1,000 fires is constant. Compared to the Indiana value the number of deaths per 1,000 incidents is much higher.
According to the reports from the years 2002 - 2017 the average number of fire-related fatalities per year is 1. The highest number of deaths - 6 took place in 2004, and the lowest - 0 in 2002. The data has a constant trend.
The average number of fatalities per 1,000 fire incidents is 2. This indicator was the highest - 10 in 2004, and the lowest 0 in 2002. The trend for fatalities per 1,000 fires is constant. Compared to the Indiana value the number of deaths per 1,000 incidents is much higher.Deaths per 1,000 incidents in Muncie, IN compared to nearest cities:
(Note: Based on data for all years, including only cities with at least 2,500 fire incidents)
| Muncie: | 2.9 |
| Marion: | 0.6 |
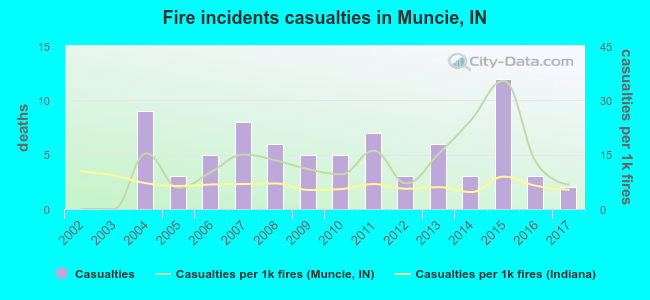 Based on the reports from the years 2002 - 2017 the average number of fire-related casualties per year is 5. The highest number of casualties - 12 took place in 2015, and the lowest - 0 in 2002. The data has a growing trend.
The average number of injuries per 1,000 fire incidents is 12. This indicator was the highest - 35 in 2015, and the lowest 0 in 2002. The trend for injuries per 1,000 incidents is growing. Compared to the Indiana value the number of casualties per 1,000 incidents is higher.
Based on the reports from the years 2002 - 2017 the average number of fire-related casualties per year is 5. The highest number of casualties - 12 took place in 2015, and the lowest - 0 in 2002. The data has a growing trend.
The average number of injuries per 1,000 fire incidents is 12. This indicator was the highest - 35 in 2015, and the lowest 0 in 2002. The trend for injuries per 1,000 incidents is growing. Compared to the Indiana value the number of casualties per 1,000 incidents is higher.Casualties per 1,000 incidents in Muncie, IN compared to nearest cities:
(Note: Based on data for all years, including only cities with at least 500 fire incidents)
| Muncie: | 13.0 |
| Yorktown: | 2.1 |
| Gaston: | 0.0 |
| Daleville: | 21.3 |
| Chesterfield: | 5.6 |
| Middletown: | 1.9 |
| Alexandria: | 25.3 |
| Anderson: | 3.5 |
| Hartford City: | 0.0 |
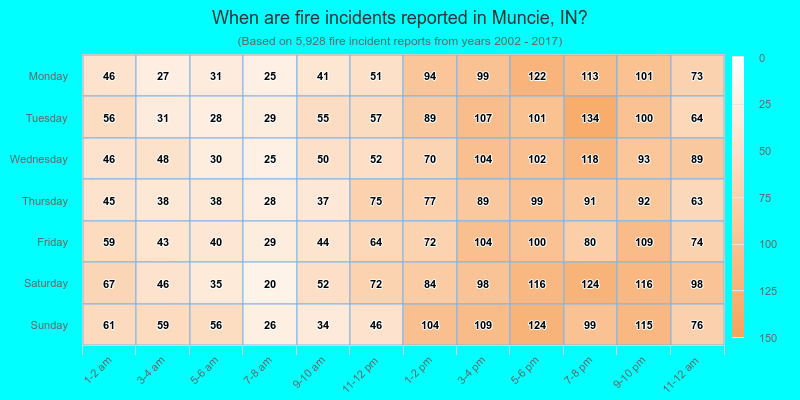
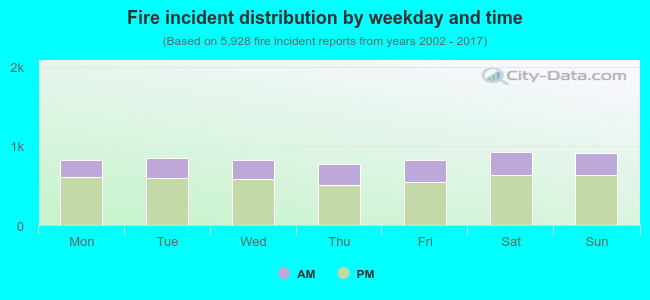 31.1% incidents where reported in the morning and 68.9% in the evening. The most fires (15.7%) took place on Saturday, and the least (13.0%) on Thursday.
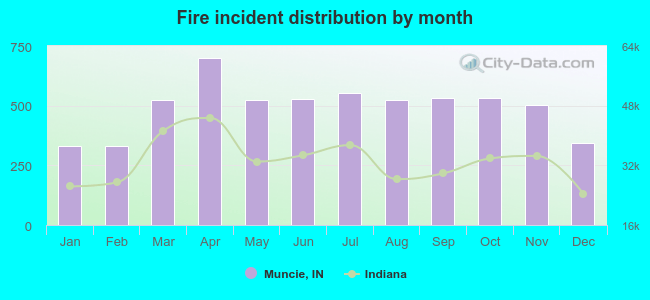 Based on the 5,928 incident reports from years 2002 - 2017 most fires (11.8%) took place during April, and the least (5.6%) in January.
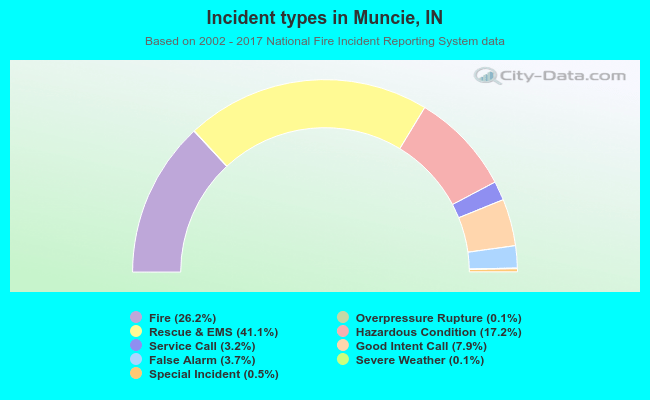 Out of all 22,665 cases reported during the years 2002 - 2017, the most belonged to the categories: Rescue & EMS (41.1%), Fire (26.2%), and Hazardous Condition (17.2%).
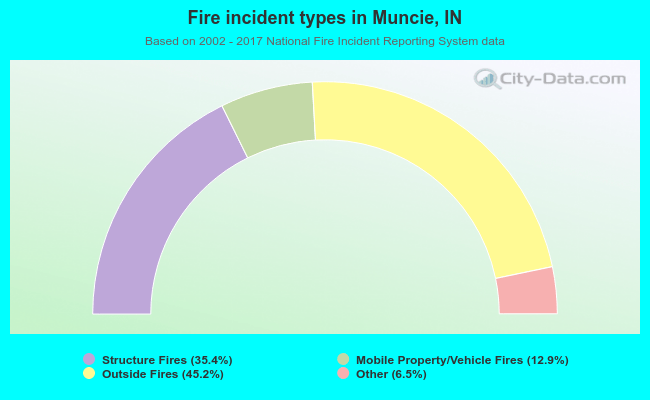 When looking into fire subcategories, the most reports belonged to: Outside Fires (45.2%), and Structure Fires (35.4%).