Murphysboro: Fire Incidents, Illinois (IL)
Where are fire incidents reported in Murphysboro, IL
Something went wrong! Please refresh the page.
| Fire incidents reported | |
|---|---|
| Sreet name | Count |
| WALNUT ST | 74 |
| 15TH ST | 32 |
| 8TH ST | 32 |
| 16TH ST | 28 |
| COUNTRY CLUB ROAD | 28 |
| HICKORY RIDGE ROAD | 28 |
| OLD HIGHWAY 13 | 28 |
| 14TH ST | 24 |
| HERBERT ST | 24 |
| WALNUT | 24 |
| AVA ROAD | 22 |
| NORTH ST | 22 |
| 7TH | 18 |
| 7TH ST | 18 |
| 9TH ST | 18 |
| ALEXANDER ST | 18 |
| SHOMAKER DR | 18 |
| 17TH ST | 16 |
| 20TH ST | 16 |
| 9TH | 16 |
| BUISNESS HWY 13 | 16 |
| HOFFMAN ROAD | 16 |
| HWY 149 | 16 |
| GARTSIDE | 14 |
| GRANGE HALL ROAD | 14 |
| HIGHWAY 127 | 14 |
| HWY 127 | 14 |
| KIMMEL BRIDGE ROAD | 14 |
| LOGAN ST | 14 |
| MAPLE ST | 14 |
| Other | 579 |
2002 - 2018 National Fire Incident Reporting System (NFIRS) incidents
- Incident types reported to NFIRS in Murphysboro, IL
- 1,22941.9%Fire
- 67423.0%Hazardous Condition
- 32511.1%False Alarm
- 29210.0%Rescue & EMS
- 2297.8%Service Call
- 1655.6%Good Intent Call
- 80.3%Special Incident
- 70.2%Overpressure Rupture
- Fire incident types reported to NFIRS in Murphysboro, IL
- 53543.5%Outside Fires
- 52542.7%Structure Fires
- 16213.2%Mobile Property/Vehicle Fires
- 70.6%Other
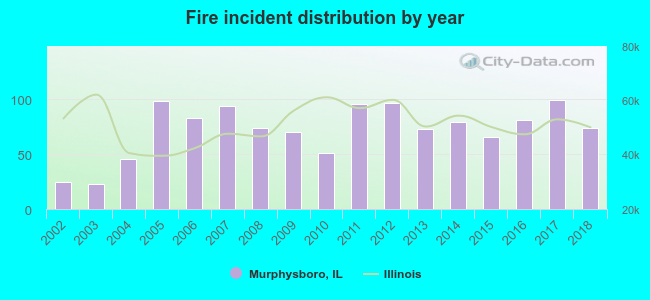 According to the data from the years 2002 - 2018 the average number of fires per year is 72. The highest number of reported fires - 99 took place in 2017, and the least - 23 in 2003. The data has a growing trend.
The average number of yearly fire incidents per 10k residents in Murphysboro, IL compared to nearest cities:
(Note: Based on data for the last 3 years, including only cities with population 5,000 and above)
| Murphysboro: | 108.4 |
| Carbondale: | 52.3 |
| Carterville: | 69.3 |
| Herrin: | 51.6 |
| Du Quoin: | 63.8 |
| Pinckneyville: | 36.7 |
| Marion: | 107.8 |
| West Frankfort: | 153.5 |
| Benton: | 150.6 |
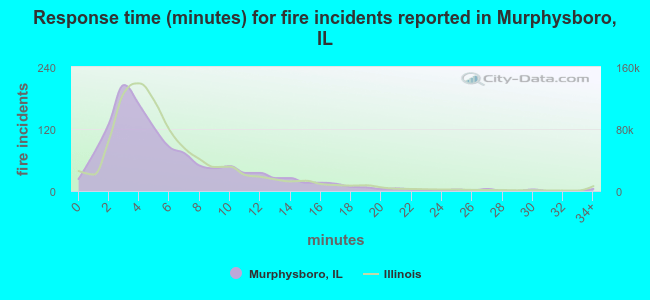 The median response time based on all reported fire incidents is 5 minutes. This is comparable to the Illinois median value.
The median response time in Murphysboro, IL compared to nearest cities:
(Note: Based on data for all years, including only cities with at least 500 fire incidents)
| Murphysboro: | 5 minutes |
| Carbondale: | 4 minutes |
| Carterville: | 6 minutes |
| Herrin: | 4 minutes |
| Mitchell: | 5 minutes |
| Anna: | 5 minutes |
| Marion: | 5 minutes |
| Johnston City: | 6 minutes |
| West Frankfort: | 5 minutes |
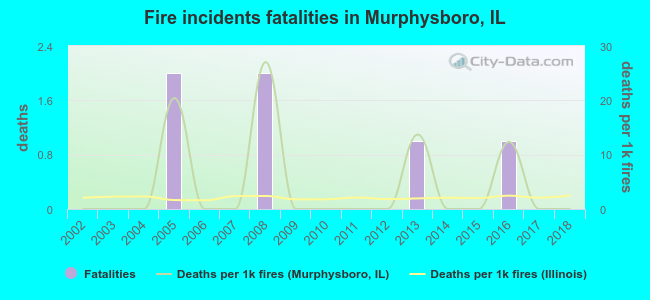 Based on the reports from the years 2002 - 2018 the average number of fire-related yearly deaths is 0. The highest number of reported deaths - 2 took place in 2005, and the lowest - 0 in 2002. The data has a constant trend.
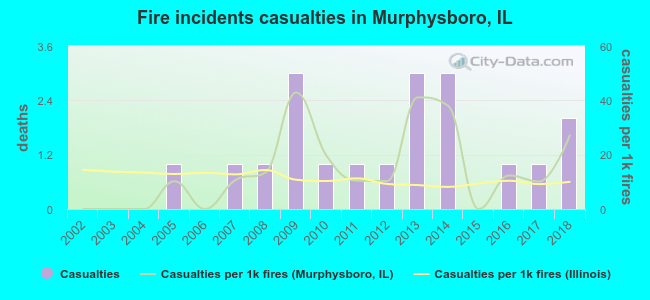 According to the data from the years 2002 - 2018 the average number of fire-related yearly casualties is 1. The highest number of casualties - 3 took place in 2009, and the lowest - 0 in 2002. The data has a growing trend.
The average number of casualties per 1,000 fire incidents is 14. This indicator was the highest - 43 in 2009, and the lowest 0 in 2002. The trend for casualties per 1,000 fire incidents is rising. Compared to the Illinois value the number of casualties per 1,000 fire incidents is higher.
According to the data from the years 2002 - 2018 the average number of fire-related yearly casualties is 1. The highest number of casualties - 3 took place in 2009, and the lowest - 0 in 2002. The data has a growing trend.
The average number of casualties per 1,000 fire incidents is 14. This indicator was the highest - 43 in 2009, and the lowest 0 in 2002. The trend for casualties per 1,000 fire incidents is rising. Compared to the Illinois value the number of casualties per 1,000 fire incidents is higher.Casualties per 1,000 incidents in Murphysboro, IL compared to nearest cities:
(Note: Based on data for all years, including only cities with at least 500 fire incidents)
| Murphysboro: | 15.5 |
| Carbondale: | 24.0 |
| Carterville: | 1.8 |
| Herrin: | 3.8 |
| Mitchell: | 5.9 |
| Anna: | 3.6 |
| Marion: | 6.2 |
| Johnston City: | 1.3 |
| West Frankfort: | 6.2 |
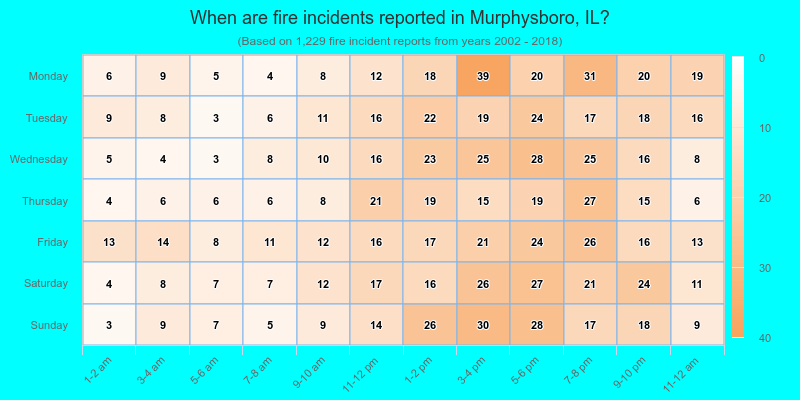
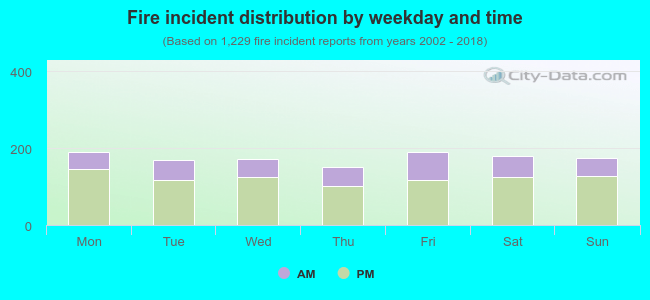 30.1% incidents where reported in the morning and 69.9% in the evening. The most fires (15.5%) took place on Monday, and the least (12.4%) on Thursday.
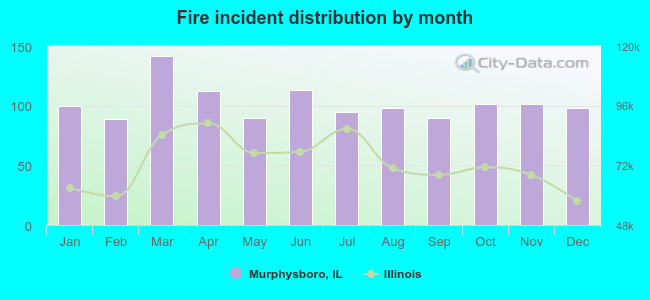 Based on the 1,229 fire incidents from years 2002 - 2018 most fires (11.6%) took place during March, and the least (7.2%) in February.
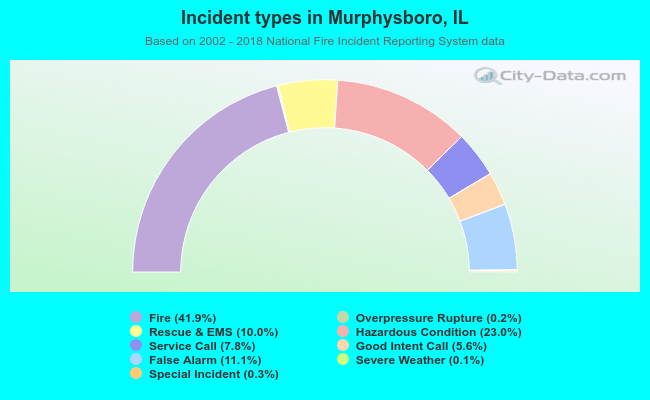 Out of all 2,931 cases reported during the years 2002 - 2018, the most belonged to the categories: Fire (41.9%), Hazardous Condition (23.0%), and False Alarm (11.1%).
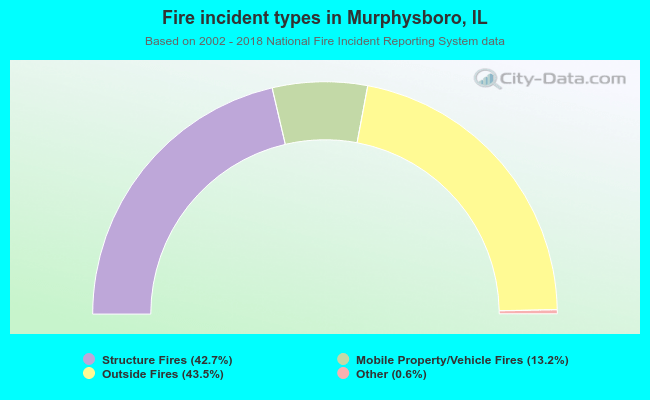 When looking into fire subcategories, the most reports belonged to: Outside Fires (43.5%), and Structure Fires (42.7%).