Murray: Fire Incidents, Utah (UT)
Where are fire incidents reported in Murray, UT
Something went wrong! Please refresh the page.
| Fire incidents reported | |
|---|---|
| Sreet name | Count |
| STATE STREET | 112 |
| VINE STREET | 96 |
| STATE ST | 76 |
| MURRAY BLVD | 74 |
| COMMERCE DR | 66 |
| 900 EAST | 60 |
| 4500 SOUTH | 58 |
| STATE | 58 |
| 4500 | 48 |
| 4800 SOUTH | 44 |
| 500 | 42 |
| 700 WEST | 42 |
| VINE ST | 42 |
| WINCHESTER ST | 42 |
| 900 | 40 |
| WINCHESTER | 40 |
| 300 WEST | 38 |
| 5600 SOUTH | 38 |
| 5300 SOUTH | 36 |
| 300 | 30 |
| I-15 NB | 28 |
| 500 WEST | 26 |
| 700 | 26 |
| STATE ST | 26 |
| 1300 | 24 |
| 1300 EAST | 24 |
| 5900 SOUTH | 22 |
| 700 EAST | 22 |
| 900 E | 22 |
| I-15 SB | 22 |
| Other | 1,259 |
2002 - 2018 National Fire Incident Reporting System (NFIRS) incidents
- Incident types reported to NFIRS in Murray, UT
- 2,58321.7%Fire
- 2,52721.2%Good Intent Call
- 2,10317.7%Rescue & EMS
- 1,88615.8%False Alarm
- 1,68414.1%Hazardous Condition
- 9728.2%Service Call
- 670.6%Special Incident
- 410.3%Overpressure Rupture
- 400.3%Severe Weather
- Fire incident types reported to NFIRS in Murray, UT
- 1,11643.2%Structure Fires
- 87834.0%Outside Fires
- 45517.6%Mobile Property/Vehicle Fires
- 1345.2%Other
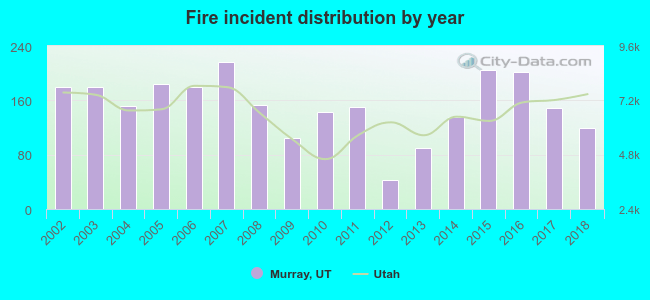 According to the data from the years 2002 - 2018 the average number of fires per year is 152. The highest number of fire incidents - 217 took place in 2007, and the least - 42 in 2012. The data has a declining trend.
The average number of yearly fire incidents per 10k residents in Murray, UT compared to nearest cities:
(Note: Based on data for the last 3 years, including only cities with population 5,000 and above)
| Murray: | 32.0 |
| Midvale: | 27.1 |
| Millcreek: | 11.9 |
| Taylorsville: | 20.8 |
| South Salt Lake: | 44.9 |
| Holladay: | 19.9 |
| East Millcreek: | 1.7 |
| Cottonwood Heights: | 14.6 |
| West Jordan: | 11.0 |
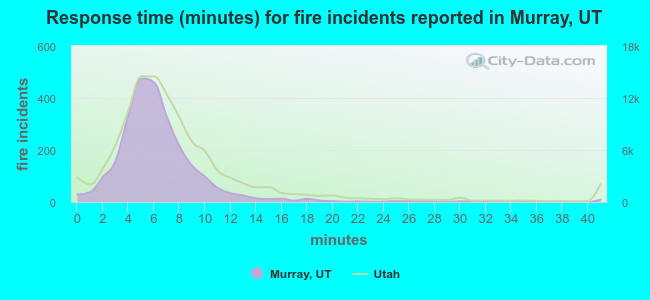 The median response time based on all reported fire incidents is 6 minutes. This is close to the state median value.
The median response time in Murray, UT compared to nearest cities:
(Note: Based on data for all years, including only cities with at least 500 fire incidents)
| Murray: | 6 minutes |
| Midvale: | 6 minutes |
| Taylorsville: | 7 minutes |
| South Salt Lake: | 6 minutes |
| Holladay: | 7 minutes |
| Cottonwood Heights: | 7 minutes |
| West Jordan: | 6 minutes |
| Sandy: | 6 minutes |
| West Valley City: | 6 minutes |
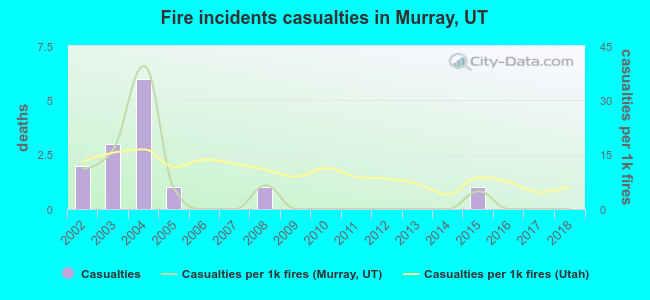 According to the reports from the years 2002 - 2018 the average number of fire-related yearly casualties is 1. The highest number of reported casualties - 6 took place in 2004, and the lowest - 0 in 2006. The data has a dropping trend.
The average number of casualties per 1,000 fire incidents is 5. This indicator was the highest - 39 in 2004, and the lowest 0 in 2006. The trend for injuries per 1,000 fire incidents is decreasing. Compared to the state value the number of injuries per 1,000 fire incidents is lower.
According to the reports from the years 2002 - 2018 the average number of fire-related yearly casualties is 1. The highest number of reported casualties - 6 took place in 2004, and the lowest - 0 in 2006. The data has a dropping trend.
The average number of casualties per 1,000 fire incidents is 5. This indicator was the highest - 39 in 2004, and the lowest 0 in 2006. The trend for injuries per 1,000 fire incidents is decreasing. Compared to the state value the number of injuries per 1,000 fire incidents is lower.Casualties per 1,000 incidents in Murray, UT compared to nearest cities:
(Note: Based on data for all years, including only cities with at least 500 fire incidents)
| Murray: | 5.4 |
| Midvale: | 13.4 |
| Taylorsville: | 8.6 |
| South Salt Lake: | 7.7 |
| Holladay: | 1.6 |
| Cottonwood Heights: | 14.7 |
| West Jordan: | 14.4 |
| Sandy: | 23.3 |
| West Valley City: | 25.5 |
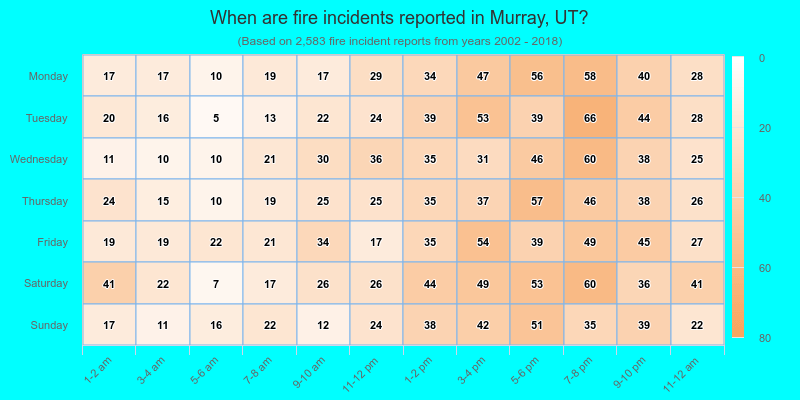
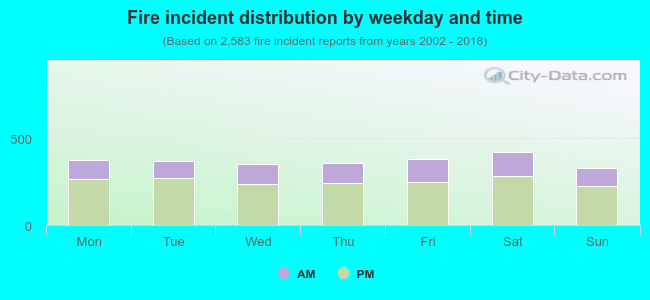 31.7% incidents where reported in the morning and 68.3% in the evening. The most fires (16.3%) took place on Saturday, and the least (12.7%) on Sunday.
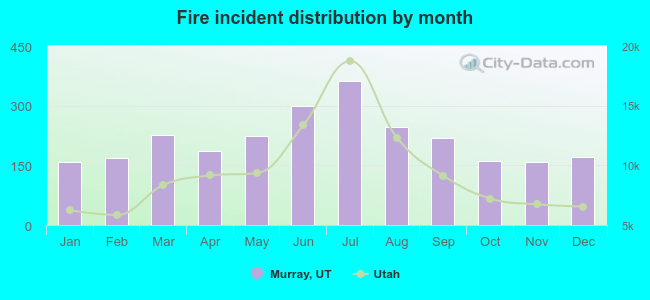 According to the 2,583 incident reports from years 2002 - 2018 most fires (14.1%) took place during July, and the least (6.1%) in January.
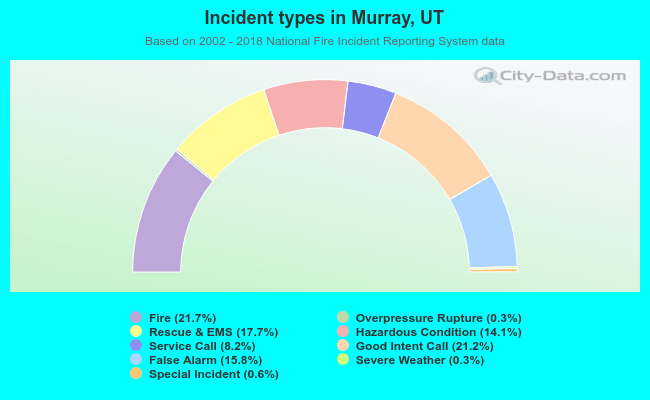 Out of all 11,903 cases reported during the years 2002 - 2018, the most belonged to the categories: Fire (21.7%), Good Intent Call (21.2%), and Rescue & EMS (17.7%).
 When looking into fire subcategories, the most reports belonged to: Structure Fires (43.2%), and Outside Fires (34.0%).