Murrieta: Fire Incidents, California (CA)
Where are fire incidents reported in Murrieta, CA
Something went wrong! Please refresh the page.
|
| |||||||||||||||||||||||||||||||||||||||||||||||||||||||||||||||||||||||||||||||||||||||||||||||||||||||||||||
2007 - 2018 National Fire Incident Reporting System (NFIRS) incidents
- Incident types reported to NFIRS in Murrieta, CA
- 16,53362.6%Rescue & EMS
- 4,44616.8%Good Intent Call
- 3,35712.7%Service Call
- 1,0874.1%False Alarm
- 4911.9%Fire
- 2541.0%Hazardous Condition
- 1330.5%Overpressure Rupture
- 1240.5%Special Incident
- Fire incident types reported to NFIRS in Murrieta, CA
- 24750.3%Outside Fires
- 11924.2%Structure Fires
- 9218.7%Mobile Property/Vehicle Fires
- 336.7%Other
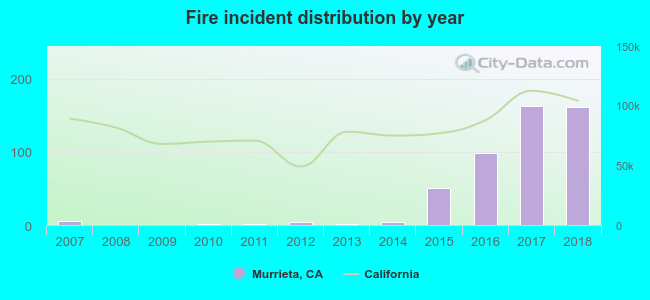 According to the data from the years 2007 - 2018 the average number of fire incidents per year is 41. The highest number of fire incidents - 163 took place in 2017, and the least - 0 in 2008. The data has a growing trend.
The average number of yearly fire incidents per 10k residents in Murrieta, CA compared to nearest cities:
(Note: Based on data for the last 3 years, including only cities with population 5,000 and above)
| Murrieta: | 13.0 |
| Wildomar: | 0.9 |
| Temecula: | 1.7 |
| Canyon Lake: | 1.4 |
| Sun City: | 0.4 |
| Lakeland Village: | 0.9 |
| Lake Elsinore: | 2.8 |
| Menifee: | 1.0 |
| Homeland: | 3.4 |
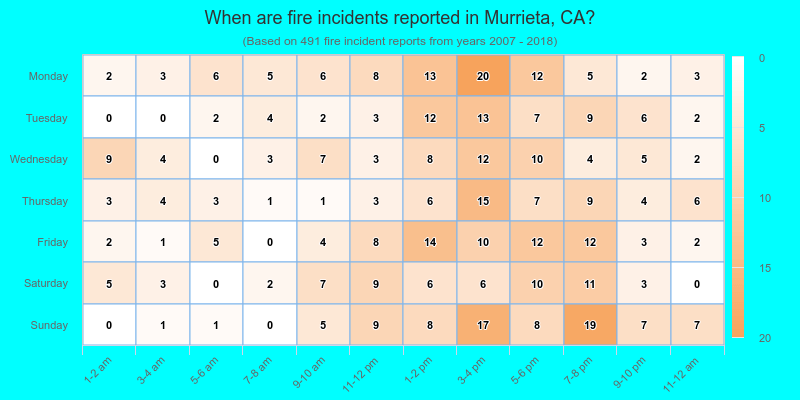
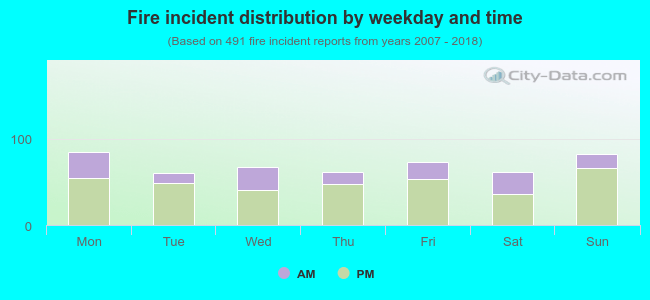 29.3% incidents where reported in the morning and 70.7% in the evening. The most fires (17.3%) took place on Monday, and the least (12.2%) on Tuesday.
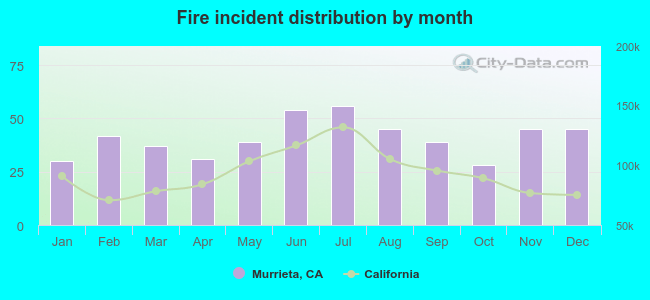 According to the 491 fire incidents from years 2007 - 2018 most fires (11.4%) took place during July, and the least (5.7%) in October.
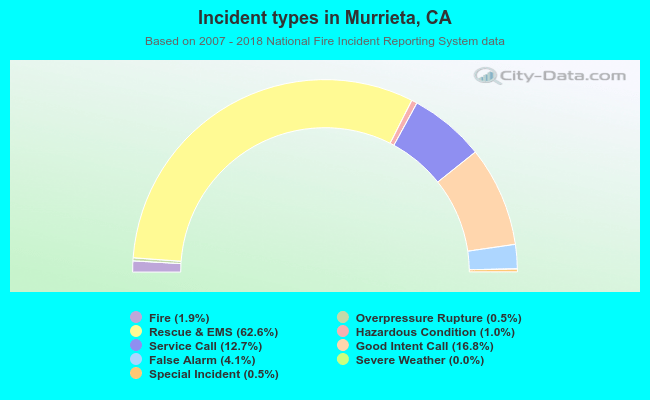 Out of all 26,429 cases reported during the years 2007 - 2018, the most belonged to the categories: Rescue & EMS (62.6%), Good Intent Call (16.8%), and Service Call (12.7%).
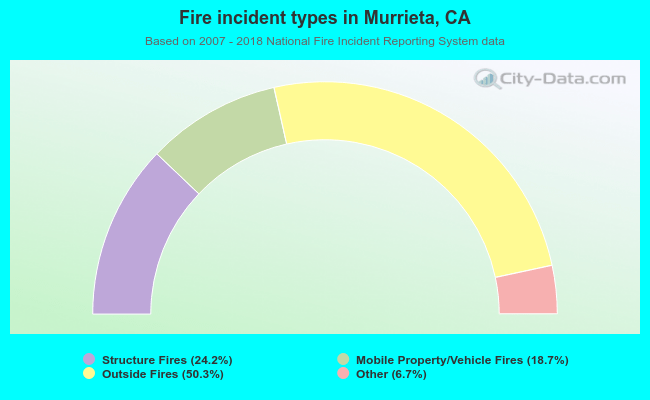 When looking into fire subcategories, the most incidents belonged to: Outside Fires (50.3%), and Structure Fires (24.2%).