Muscoy: Fire Incidents, California (CA)
Where are fire incidents reported in Muscoy, CA
Something went wrong! Please refresh the page.
|
| |||||||||||||||||||||||||||||||||||||||||||||||||||||||||||||||||||||||||||||||||||||||||||||||||||||
2007 - 2018 National Fire Incident Reporting System (NFIRS) incidents
- Incident types reported to NFIRS in Muscoy, CA
- 1,41168.5%Rescue & EMS
- 26612.9%Good Intent Call
- 1436.9%Fire
- 1215.9%Service Call
- 783.8%Hazardous Condition
- 351.7%False Alarm
- 50.2%Special Incident
- Fire incident types reported to NFIRS in Muscoy, CA
- 6948.3%Outside Fires
- 4330.1%Structure Fires
- 2517.5%Mobile Property/Vehicle Fires
- 64.2%Other
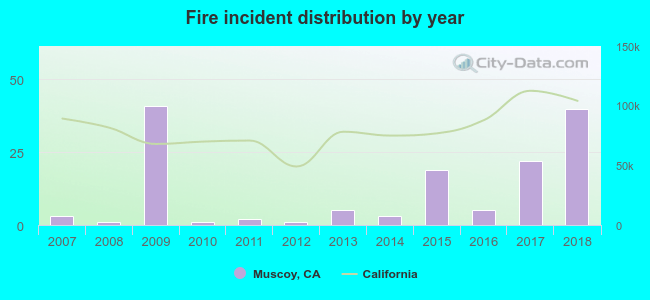 According to the data from the years 2007 - 2018 the average number of fire incidents per year is 12. The highest number of fire incidents - 41 took place in 2009, and the least - 1 in 2008. The data has a growing trend.
The average number of yearly fire incidents per 10k residents in Muscoy, CA compared to nearest cities:
(Note: Based on data for the last 3 years, including only cities with population 5,000 and above)
| Muscoy: | 21.0 |
| San Bernardino: | 22.7 |
| Rialto: | 4.3 |
| Colton: | 60.0 |
| Crestline: | 13.3 |
| Bloomington: | 11.2 |
| Fontana: | 8.5 |
| Highland: | 2.4 |
| Grand Terrace: | 8.3 |
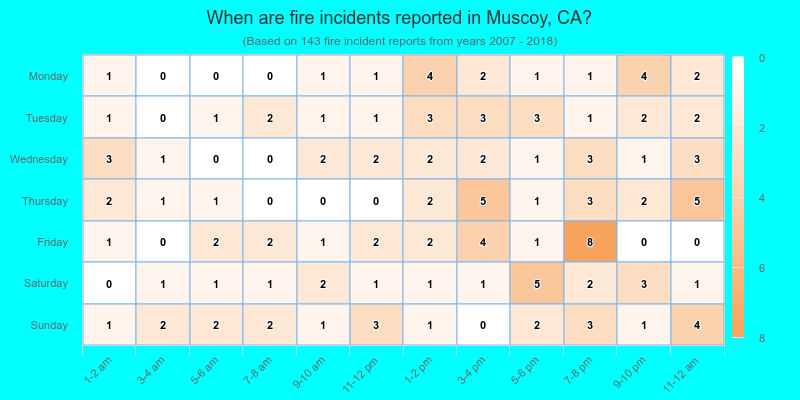
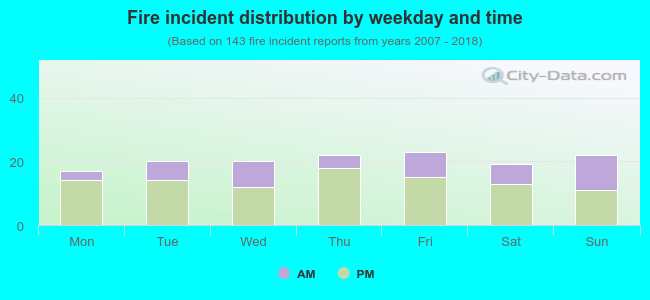 32.2% incidents where reported in the morning and 67.8% in the evening. The most fires (16.1%) took place on Friday, and the least (11.9%) on Monday.
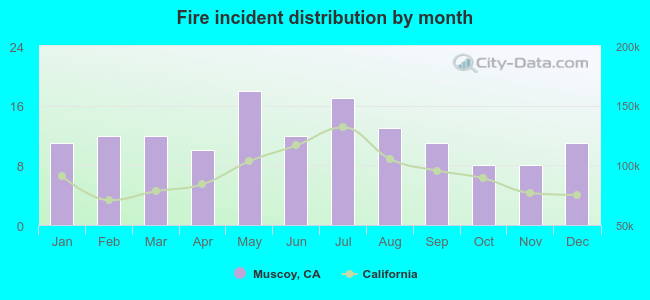 According to the 143 fire incidents from years 2007 - 2018 most fires (12.6%) took place during May, and the least (5.6%) in October.
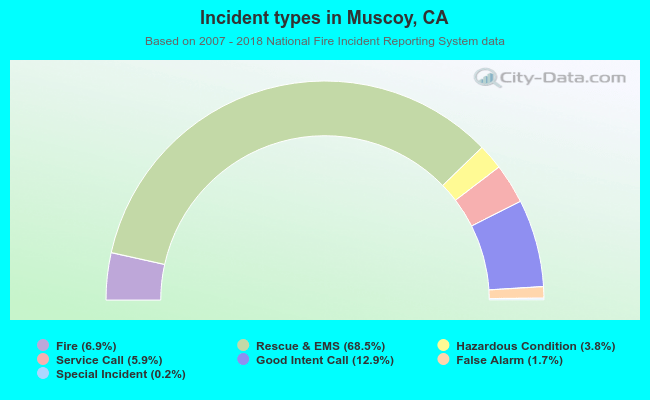 Out of all 2,059 cases reported during the years 2007 - 2018, the most belonged to the categories: Overpressure Rupture (68.5%), Service Call (12.9%), and Fire (6.9%).
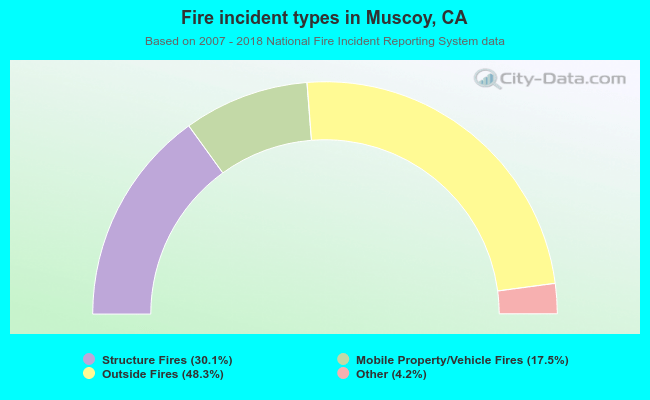 When looking into fire subcategories, the most incidents belonged to: Outside Fires (48.3%), and Structure Fires (30.1%).