Neelyville: Fire Incidents, Missouri (MO)
Where are fire incidents reported in Neelyville, MO
Something went wrong! Please refresh the page.
|
| |||||||||||||||||||||||||||||||||||||||||||||||||||||||||||||||||||||||||||||||||||||||||||||||||||||||||||||
2004 - 2018 National Fire Incident Reporting System (NFIRS) incidents
- Incident types reported to NFIRS in Neelyville, MO
- 31283.9%Fire
- 287.5%Good Intent Call
- 236.2%Hazardous Condition
- 61.6%Rescue & EMS
- 20.5%Service Call
- 10.3%False Alarm
- Fire incident types reported to NFIRS in Neelyville, MO
- 16452.6%Outside Fires
- 8727.9%Structure Fires
- 5718.3%Mobile Property/Vehicle Fires
- 41.3%Other
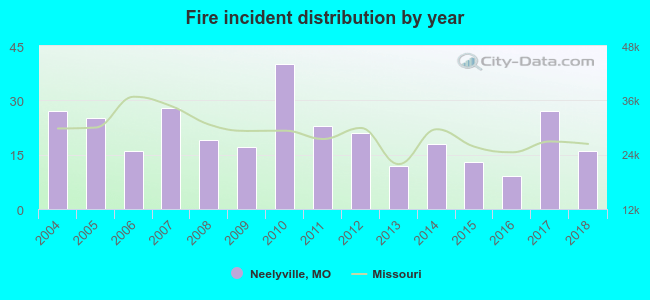 Based on the data from the years 2004 - 2018 the average number of fire incidents per year is 21. The highest number of reported fire incidents - 40 took place in 2010, and the least - 9 in 2016. The data has a dropping trend.
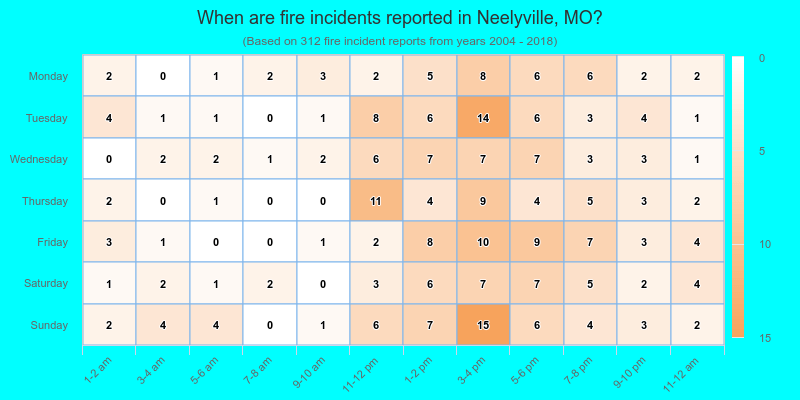
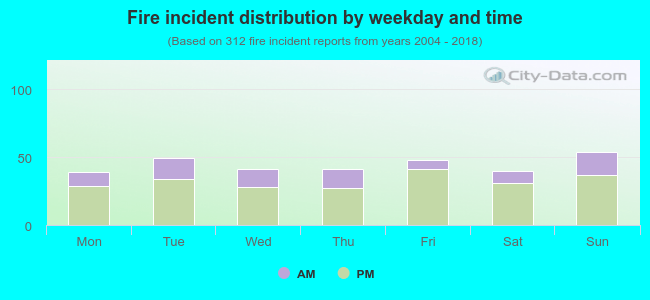 27.2% incidents where reported in the morning and 72.8% in the evening. The most fires (17.3%) took place on Sunday, and the least (12.5%) on Monday.
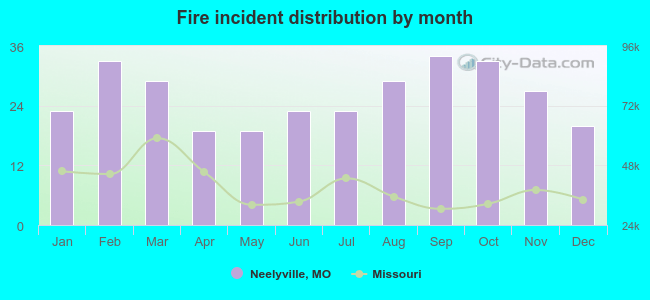 According to the 312 fires from years 2004 - 2018 most fires (10.9%) took place during September, and the least (6.1%) in April.
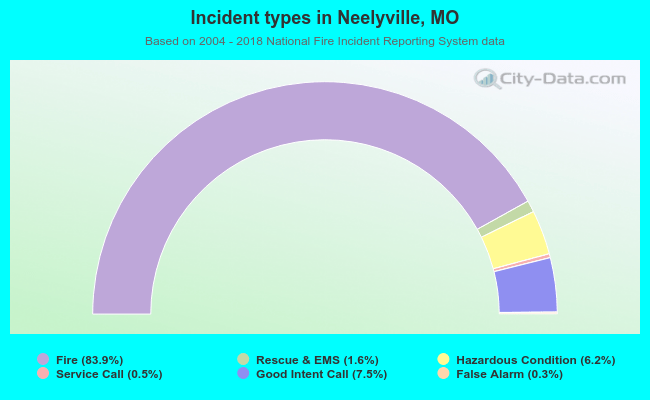 Out of all 372 cases reported during the years 2004 - 2018, the most belonged to the categories: Fire (83.9%), Service Call (7.5%), and Rescue & EMS (6.2%).
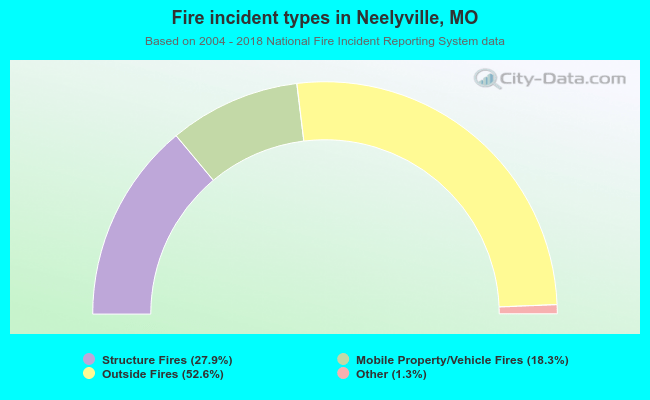 When looking into fire subcategories, the most incidents belonged to: Outside Fires (52.6%), and Structure Fires (27.9%).