New Orleans: Fire Incidents, Louisiana (LA)
Where are fire incidents reported in New Orleans, LA
Something went wrong! Please refresh the page.
| Fire incidents reported | |
|---|---|
| Sreet name | Count |
| CHEF MENTEUR HWY | 1,232 |
| CLAIBORNE AVE | 846 |
| OLD GENTILLY RD | 734 |
| I-10 | 588 |
| ALMONASTER AVE | 570 |
| CANAL ST | 480 |
| I10 | 458 |
| ELYSIAN FIELDS AVE | 404 |
| FLORIDA AVE | 390 |
| GALVEZ ST | 372 |
| CARROLLTON AVE | 346 |
| ST CHARLES AVE | 336 |
| FRANKLIN AVE | 324 |
| ST CLAUDE AVE | 306 |
| MAGAZINE ST | 304 |
| DERBIGNY ST | 282 |
| DORGENOIS ST | 278 |
| ROCHEBLAVE ST | 270 |
| ROSEDALE DR | 270 |
| BROAD ST | 262 |
| ROBERTSON ST | 252 |
| PRIEUR ST | 248 |
| TULLIS DR | 242 |
| WASHINGTON AVE | 230 |
| JOHNSON ST | 216 |
| CONTI ST | 202 |
| ORLEANS AVE | 202 |
| BUNDY RD | 200 |
| CHEF MENTEUR HW | 200 |
| ROYAL ST | 198 |
| Other | 16,428 |
2002 - 2018 National Fire Incident Reporting System (NFIRS) incidents
- Incident types reported to NFIRS in New Orleans, LA
- 113,93450.8%Rescue & EMS
- 30,98713.8%False Alarm
- 30,56413.6%Hazardous Condition
- 27,67012.3%Fire
- 15,0016.7%Good Intent Call
- 5,3052.4%Service Call
- 3840.2%Special Incident
- Fire incident types reported to NFIRS in New Orleans, LA
- 11,69842.3%Structure Fires
- 9,48634.3%Mobile Property/Vehicle Fires
- 5,52720.0%Outside Fires
- 9593.5%Other
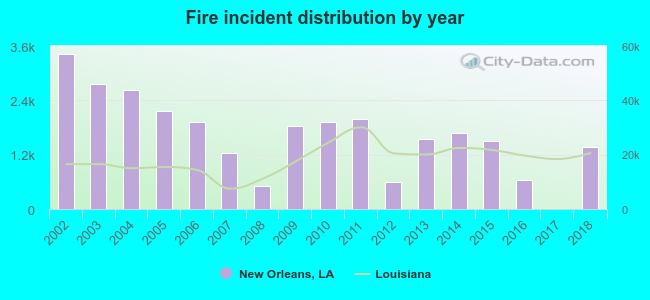 According to the data from the years 2002 - 2018 the average number of fires per year is 1,628. The highest number of fires - 3,427 took place in 2002, and the least - 1 in 2017. The data has a decreasing trend.
The average number of yearly fire incidents per 10k residents in New Orleans, LA compared to nearest cities:
(Note: Based on data for the last 3 years, including only cities with population 5,000 and above)
| New Orleans: | 17.3 |
| Gretna: | 38.5 |
| Terrytown: | 46.7 |
| Harvey: | 77.3 |
| Jefferson: | 47.1 |
| Chalmette: | 55.9 |
| Marrero: | 60.6 |
| Westwego: | 38.6 |
| Bridge City: | 23.4 |
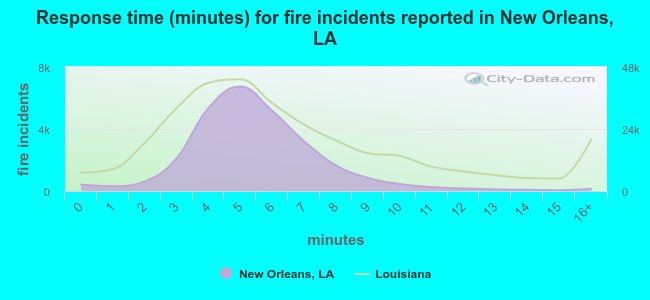 The median response time based on all reported fire incidents is 5 minutes. This is lower than the state median value.
The median response time in New Orleans, LA compared to nearest cities:
(Note: Based on data for all years, including only cities with at least 500 fire incidents)
| New Orleans: | 5 minutes |
| Gretna: | 3 minutes |
| Terrytown: | 4 minutes |
| Harvey: | 4 minutes |
| Jefferson: | 4 minutes |
| Chalmette: | 4 minutes |
| Marrero: | 4 minutes |
| Westwego: | 2 minutes |
| Metairie: | 4 minutes |
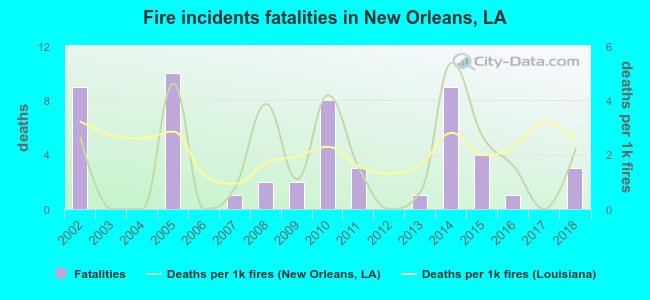 Based on the reports from the years 2002 - 2018 the average number of fire-related fatalities per year is 3. The highest number of reported deaths - 10 took place in 2005, and the lowest - 0 in 2003. The data has a dropping trend.
The average number of fatalities per 1,000 fire incidents is 2. This indicator was the highest - 5 in 2014, and the lowest 0 in 2003. The trend for fatalities per 1,000 fire incidents is decreasing. Compared to the Louisiana value the number of deaths per 1,000 fires is similar.
Based on the reports from the years 2002 - 2018 the average number of fire-related fatalities per year is 3. The highest number of reported deaths - 10 took place in 2005, and the lowest - 0 in 2003. The data has a dropping trend.
The average number of fatalities per 1,000 fire incidents is 2. This indicator was the highest - 5 in 2014, and the lowest 0 in 2003. The trend for fatalities per 1,000 fire incidents is decreasing. Compared to the Louisiana value the number of deaths per 1,000 fires is similar.
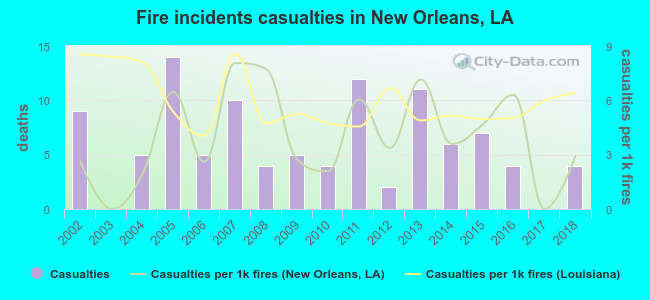 According to the reports from the years 2002 - 2018 the average number of fire-related yearly casualties is 6. The highest number of reported injuries - 14 took place in 2005, and the lowest - 0 in 2003. The data has a declining trend.
The average number of casualties per 1,000 fire incidents is 4. This indicator was the highest - 8 in 2007, and the lowest 0 in 2003. The trend for casualties per 1,000 fire incidents is rising. Compared to the state value the number of injuries per 1,000 fires is lower.
According to the reports from the years 2002 - 2018 the average number of fire-related yearly casualties is 6. The highest number of reported injuries - 14 took place in 2005, and the lowest - 0 in 2003. The data has a declining trend.
The average number of casualties per 1,000 fire incidents is 4. This indicator was the highest - 8 in 2007, and the lowest 0 in 2003. The trend for casualties per 1,000 fire incidents is rising. Compared to the state value the number of injuries per 1,000 fires is lower.
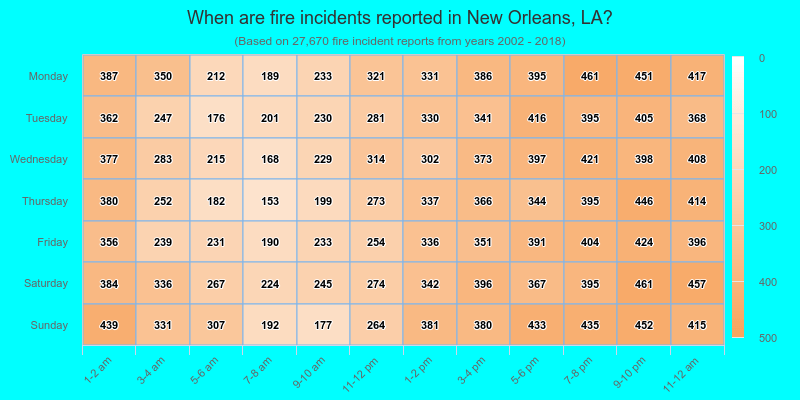
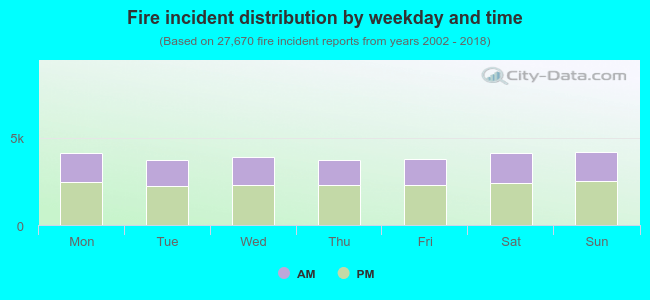 40.3% incidents where reported in the morning and 59.7% in the evening. The most fires (15.2%) took place on Sunday, and the least (13.5%) on Thursday.
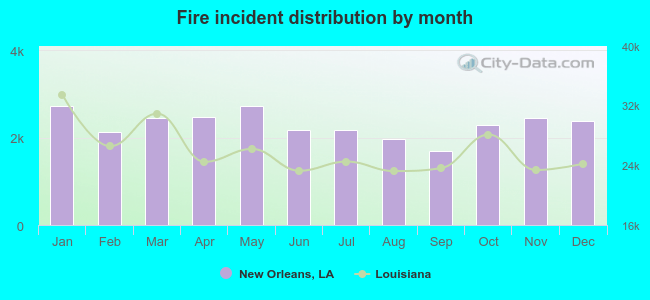 According to the 27,670 reports from years 2002 - 2018 most fires (9.9%) took place during May, and the least (6.1%) in September.
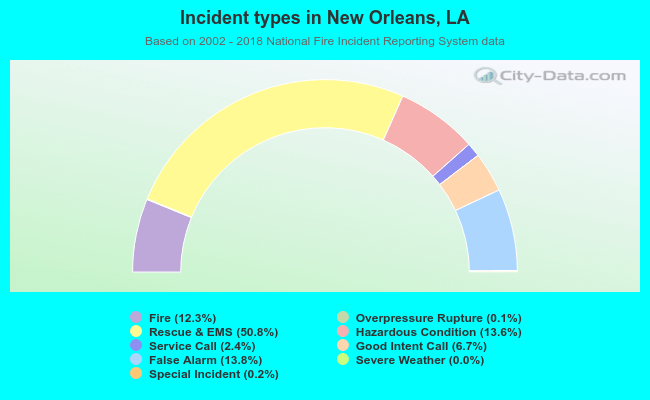 Out of all 224,091 cases reported during the years 2002 - 2018, the most belonged to the categories: Rescue & EMS (50.8%), False Alarm (13.8%), and Hazardous Condition (13.6%).
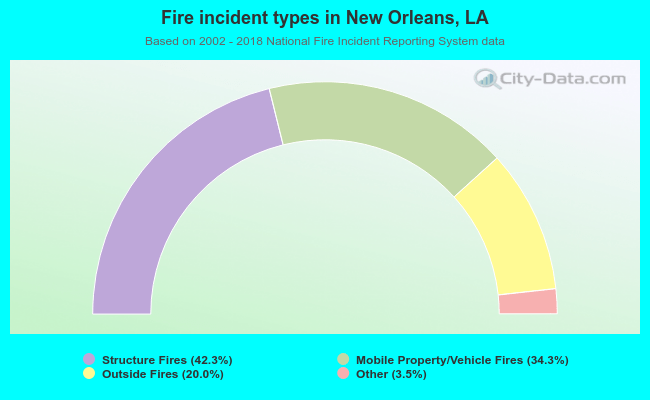 When looking into fire subcategories, the most reports belonged to: Structure Fires (42.3%), and Mobile Property/Vehicle Fires (34.3%).