Newark: Fire Incidents, Arkansas (AR)
Where are fire incidents reported in Newark, AR
Something went wrong! Please refresh the page.
|
| |||||||||||||||||||||||||||||||||||||||||||||||||||||||||||||||||||||||||||||||||||||||||||||||||||||||||||||
2004 - 2018 National Fire Incident Reporting System (NFIRS) incidents
- Incident types reported to NFIRS in Newark, AR
- 23672.4%Fire
- 3711.3%Rescue & EMS
- 164.9%Hazardous Condition
- 144.3%Good Intent Call
- 92.8%False Alarm
- 72.1%Service Call
- 41.2%Severe Weather
- 30.9%Overpressure Rupture
- Fire incident types reported to NFIRS in Newark, AR
- 14260.2%Outside Fires
- 6527.5%Structure Fires
- 208.5%Mobile Property/Vehicle Fires
- 93.8%Other
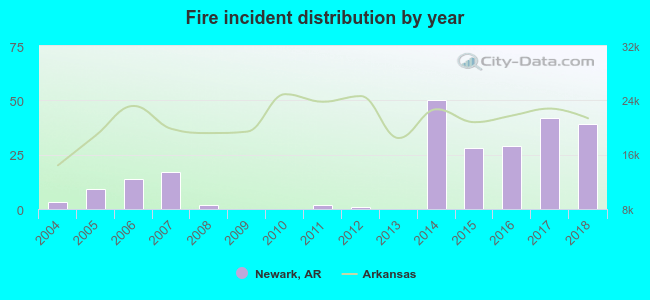 According to the data from the years 2004 - 2018 the average number of fire incidents per year is 16. The highest number of fire incidents - 50 took place in 2014, and the least - 0 in 2009. The data has an increasing trend.
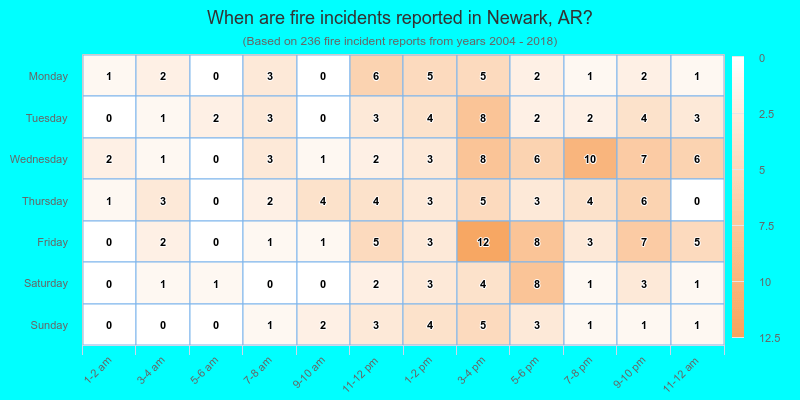
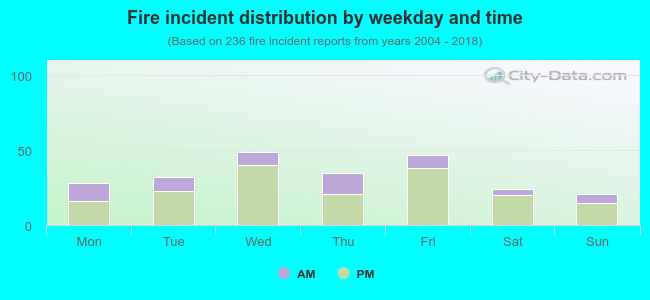 26.7% incidents where reported in the morning and 73.3% in the evening. The most fires (20.8%) took place on Wednesday, and the least (8.9%) on Sunday.
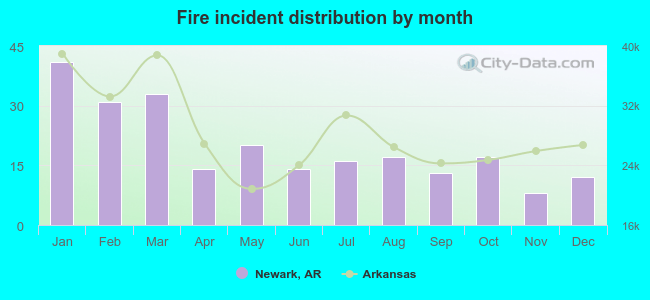 Based on the 236 reports from years 2004 - 2018 most fires (17.4%) took place during January, and the least (3.4%) in November.
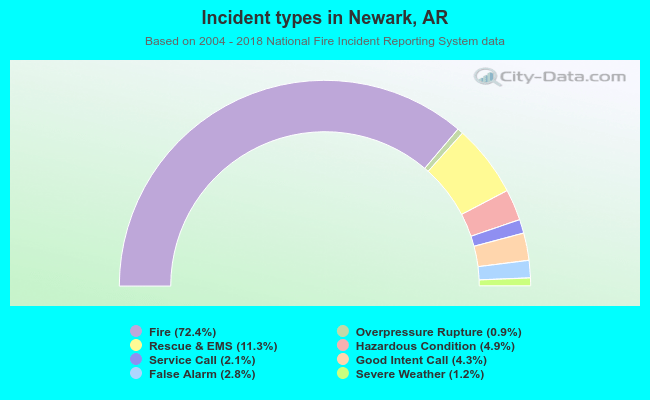 Out of all 326 cases reported during the years 2004 - 2018, the most belonged to the categories: Fire (72.4%), Rescue & EMS (11.3%), and Hazardous Condition (4.9%).
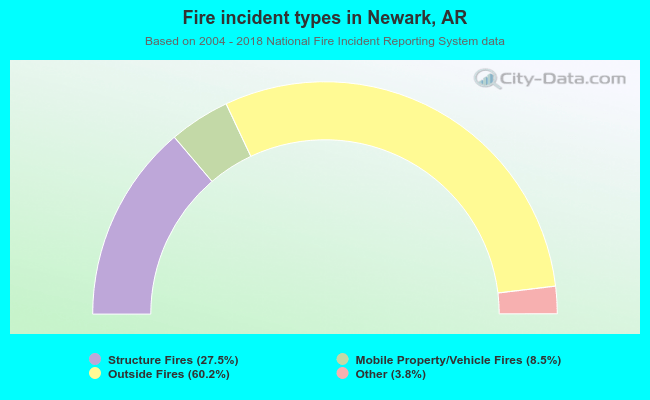 When looking into fire subcategories, the most incidents belonged to: Outside Fires (60.2%), and Structure Fires (27.5%).