Newark: Fire Incidents, Delaware (DE)
Where are fire incidents reported in Newark, DE
Something went wrong! Please refresh the page.
| Fire incidents reported | |
|---|---|
| Sreet name | Count |
| MAIN ST | 680 |
| FAIRWAY RD | 506 |
| CHESWOLD BLVD | 336 |
| COLLEGE AVE | 290 |
| CAPITOL TRL | 226 |
| WINTERHAVEN DR | 222 |
| OLD BALTIMORE PIKE | 220 |
| PULASKI HWY | 216 |
| OGLETOWN RD | 200 |
| CHESTNUT HILL RD | 180 |
| SHELDON DR | 178 |
| KIMBERTON DR | 170 |
| ELKTON RD | 154 |
| CHRISTIANA RD | 152 |
| MARROWS RD | 148 |
| CHAPEL ST | 134 |
| CHESTNUT CROSSING DR | 132 |
| LEHIGH RD | 130 |
| WINCHESTER RD | 130 |
| CHURCHMANS RD | 128 |
| SANDALWOOD DR | 126 |
| DELAWARE AVE | 112 |
| CAPANO DR | 110 |
| BROOKEDGE CT | 102 |
| CHAPMAN RD | 102 |
| STANTON CHRISTIANA RD | 100 |
| STANTON OGLETOWN RD | 98 |
| SALEM CHURCH RD | 96 |
| ACADEMY ST | 94 |
| WHARTON DR | 94 |
| Other | 4,852 |
2002 - 2018 National Fire Incident Reporting System (NFIRS) incidents
- Incident types reported to NFIRS in Newark, DE
- 10,41828.3%Fire
- 7,63520.7%Rescue & EMS
- 6,34017.2%Good Intent Call
- 6,19216.8%Hazardous Condition
- 4,96413.5%False Alarm
- 1,1743.2%Service Call
- 740.2%Overpressure Rupture
- Fire incident types reported to NFIRS in Newark, DE
- 6,80765.3%Structure Fires
- 2,27121.8%Outside Fires
- 1,15911.1%Mobile Property/Vehicle Fires
- 1811.7%Other
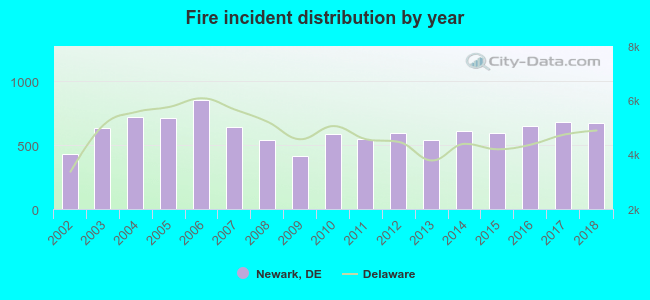 According to the data from the years 2002 - 2018 the average number of fires per year is 613. The highest number of fires - 851 took place in 2006, and the least - 415 in 2009. The data has a growing trend.
The average number of yearly fire incidents per 10k residents in Newark, DE compared to nearest cities:
(Note: Based on data for the last 3 years, including only cities with population 5,000 and above)
| Newark: | 202.9 |
| Pike Creek: | 3.2 |
| Glasgow: | 1.4 |
| Bear: | 92.9 |
| Hockessin: | 23.4 |
| Wilmington Manor: | 3.8 |
| Elsmere: | 19.0 |
| New Castle: | 1,020.0 |
| Wilmington: | 159.3 |
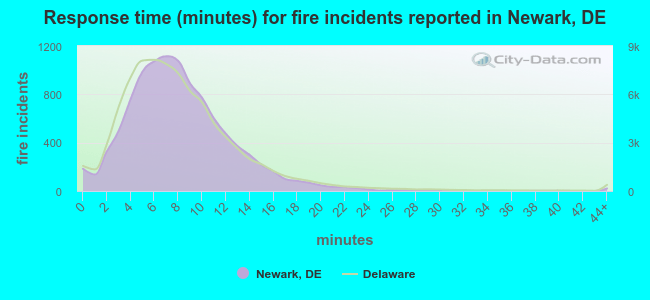 The median response time based on all reported fire incidents is 8 minutes. This is similar to the Delaware median value.
The median response time in Newark, DE compared to nearest cities:
(Note: Based on data for all years, including only cities with at least 500 fire incidents)
| Newark: | 8 minutes |
| Bear: | 9 minutes |
| Hockessin: | 8 minutes |
| New Castle: | 7 minutes |
| Delaware City: | 8 minutes |
| Wilmington: | 6 minutes |
| Middletown: | 8 minutes |
| Claymont: | 6 minutes |
| Townsend: | 9 minutes |
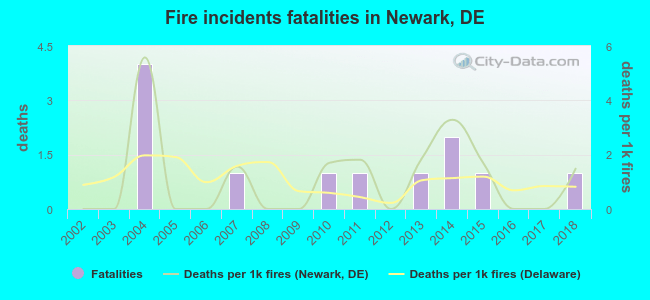 According to the data from the years 2002 - 2018 the average number of fire-related yearly deaths is 1. The highest number of deaths - 4 took place in 2004, and the lowest - 0 in 2002. The data has an increasing trend.
The average number of deaths per 1,000 fire incidents is 1. This indicator was the highest - 6 in 2004, and the lowest 0 in 2002. The trend for fatalities per 1,000 fires is rising. Compared to the state value the number of fatalities per 1,000 fire incidents is similar.
According to the data from the years 2002 - 2018 the average number of fire-related yearly deaths is 1. The highest number of deaths - 4 took place in 2004, and the lowest - 0 in 2002. The data has an increasing trend.
The average number of deaths per 1,000 fire incidents is 1. This indicator was the highest - 6 in 2004, and the lowest 0 in 2002. The trend for fatalities per 1,000 fires is rising. Compared to the state value the number of fatalities per 1,000 fire incidents is similar.Deaths per 1,000 incidents in Newark, DE compared to nearest cities:
(Note: Based on data for all years, including only cities with at least 2,500 fire incidents)
| Newark: | 1.2 |
| Bear: | 0.4 |
| New Castle: | 1.7 |
| Wilmington: | 0.6 |
| Middletown: | 1.1 |
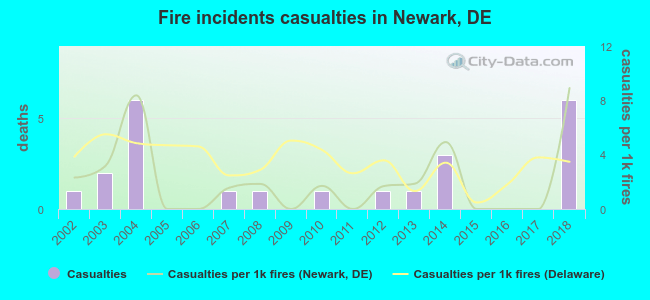 According to the data from the years 2002 - 2018 the average number of fire-related casualties per year is 1. The highest number of casualties - 6 took place in 2004, and the lowest - 0 in 2005. The data has a growing trend.
The average number of injuries per 1,000 fires is 2. This indicator was the highest - 9 in 2018, and the lowest 0 in 2005. The trend for injuries per 1,000 fires is rising. Compared to the state value the number of casualties per 1,000 fire incidents is lower.
According to the data from the years 2002 - 2018 the average number of fire-related casualties per year is 1. The highest number of casualties - 6 took place in 2004, and the lowest - 0 in 2005. The data has a growing trend.
The average number of injuries per 1,000 fires is 2. This indicator was the highest - 9 in 2018, and the lowest 0 in 2005. The trend for injuries per 1,000 fires is rising. Compared to the state value the number of casualties per 1,000 fire incidents is lower.Casualties per 1,000 incidents in Newark, DE compared to nearest cities:
(Note: Based on data for all years, including only cities with at least 500 fire incidents)
| Newark: | 2.2 |
| Bear: | 6.0 |
| Hockessin: | 1.3 |
| New Castle: | 3.4 |
| Delaware City: | 6.2 |
| Wilmington: | 4.5 |
| Middletown: | 3.8 |
| Claymont: | 6.4 |
| Townsend: | 4.1 |
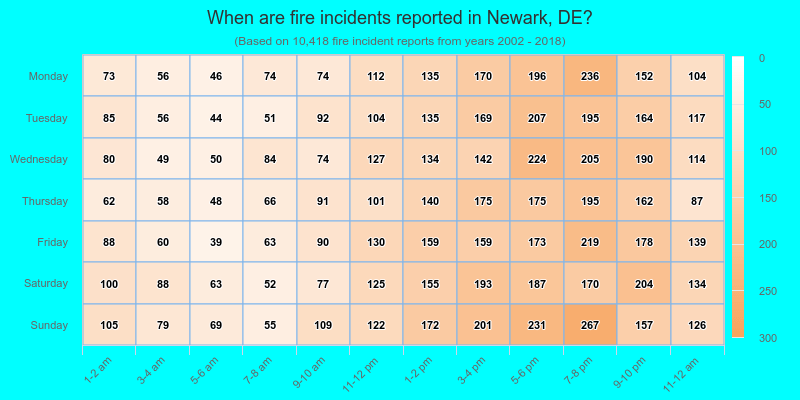
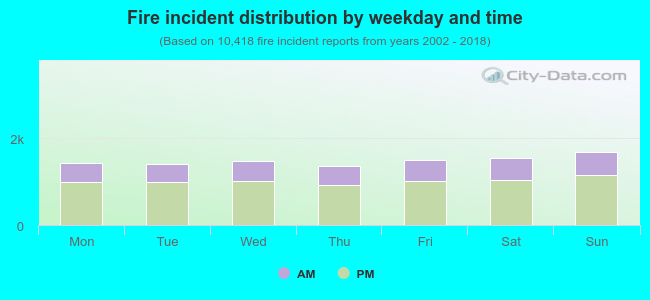 31.4% incidents where reported in the morning and 68.6% in the evening. The most fires (16.3%) took place on Sunday, and the least (13.1%) on Thursday.
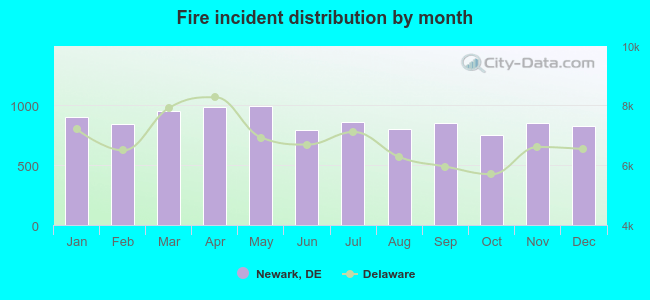 Based on the 10,418 incident reports from years 2002 - 2018 most fires (9.6%) took place during May, and the least (7.2%) in October.
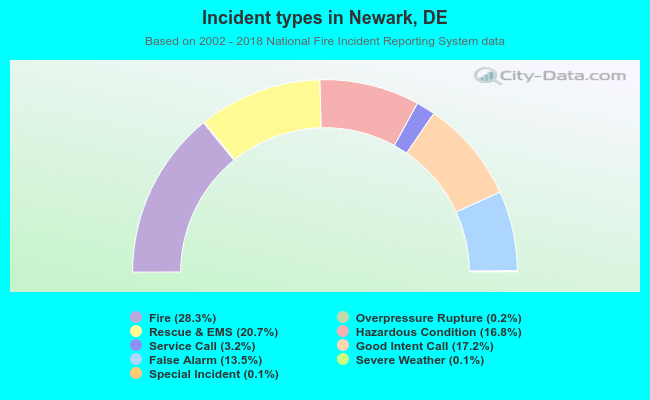 Out of all 36,859 cases reported during the years 2002 - 2018, the most belonged to the categories: Fire (28.3%), Rescue & EMS (20.7%), and Good Intent Call (17.2%).
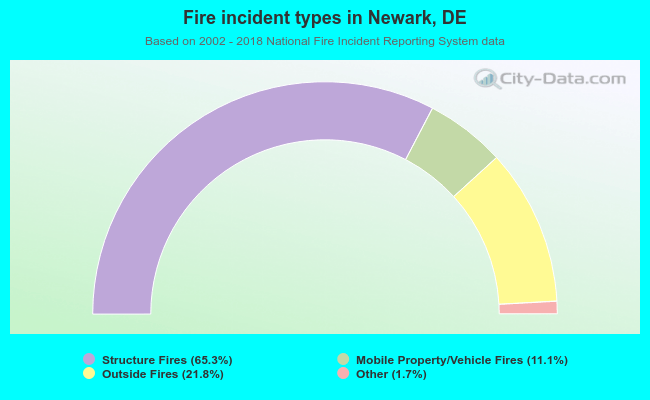 When looking into fire subcategories, the most reports belonged to: Structure Fires (65.3%), and Outside Fires (21.8%).