Newberry: Fire Incidents, Florida (FL)
Where are fire incidents reported in Newberry, FL
Something went wrong! Please refresh the page.
|
| |||||||||||||||||||||||||||||||||||||||||||||||||||||||||||||||||||||||||||||||||||||||||||||||||||||||||||||
2002 - 2018 National Fire Incident Reporting System (NFIRS) incidents
- Incident types reported to NFIRS in Newberry, FL
- 5,17174.6%Rescue & EMS
- 6599.5%Good Intent Call
- 5427.8%Fire
- 2022.9%Hazardous Condition
- 1782.6%False Alarm
- 1642.4%Service Call
- 110.2%Special Incident
- Fire incident types reported to NFIRS in Newberry, FL
- 27049.8%Outside Fires
- 17632.5%Structure Fires
- 8315.3%Mobile Property/Vehicle Fires
- 132.4%Other
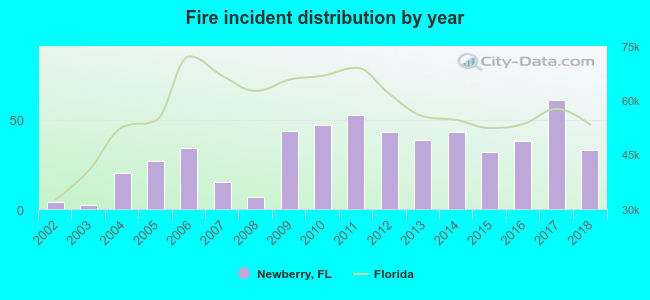 According to the data from the years 2002 - 2018 the average number of fires per year is 32. The highest number of reported fire incidents - 61 took place in 2017, and the least - 2 in 2003. The data has a rising trend.
The average number of yearly fire incidents per 10k residents in Newberry, FL compared to nearest cities:
(Note: Based on data for the last 3 years, including only cities with population 5,000 and above)
| Newberry: | 81.3 |
| Alachua: | 48.1 |
| High Springs: | 17.0 |
| Gainesville: | 33.8 |
| Starke: | 142.4 |
| Lake City: | 288.4 |
| Ocala: | 141.4 |
| Citrus Springs: | 7.5 |
| Sanderson: | 27.4 |
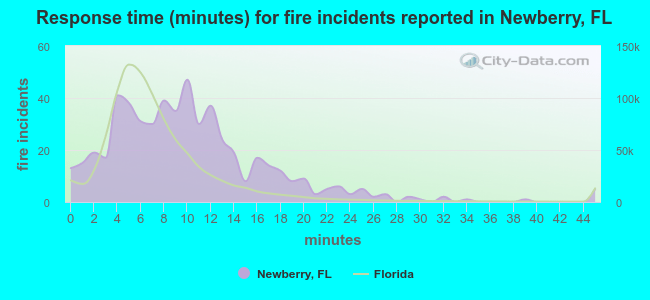 The median response time based on all reported fire incidents is 9 minutes. This is higher compared to the state median value.
The median response time in Newberry, FL compared to nearest cities:
(Note: Based on data for all years, including only cities with at least 500 fire incidents)
| Newberry: | 9 minutes |
| Alachua: | 10 minutes |
| Trenton: | 13 minutes |
| High Springs: | 9 minutes |
| Bronson: | 13 minutes |
| Gainesville: | 6 minutes |
| Chiefland: | 9 minutes |
| Fanning Springs: | 12 minutes |
| Williston: | 9 minutes |
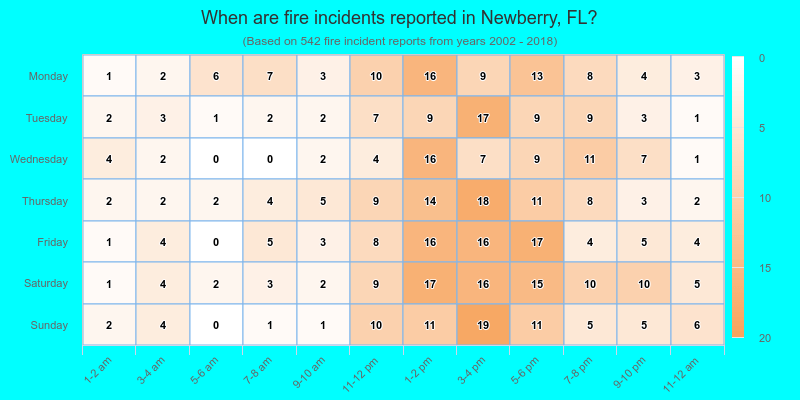
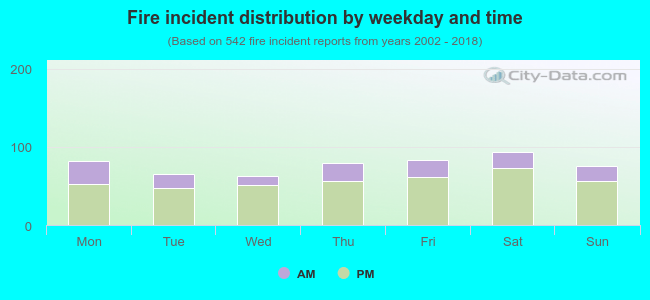 26.2% incidents where reported in the morning and 73.8% in the evening. The most fires (17.3%) took place on Saturday, and the least (11.6%) on Wednesday.
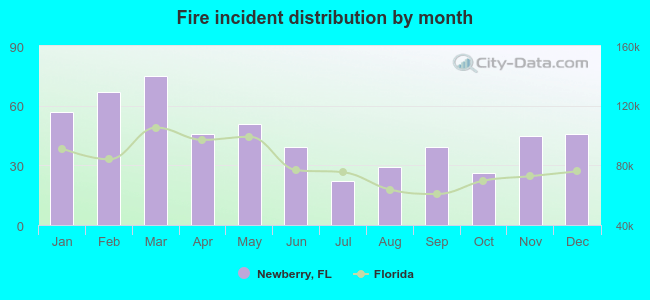 Based on the 542 incident reports from years 2002 - 2018 most fires (13.8%) took place during March, and the least (4.1%) in July.
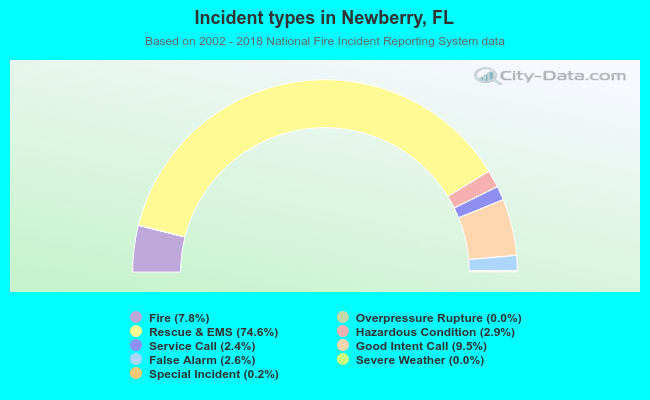 Out of all 6,929 cases reported during the years 2002 - 2018, the most belonged to the categories: Rescue & EMS (74.6%), Good Intent Call (9.5%), and Fire (7.8%).
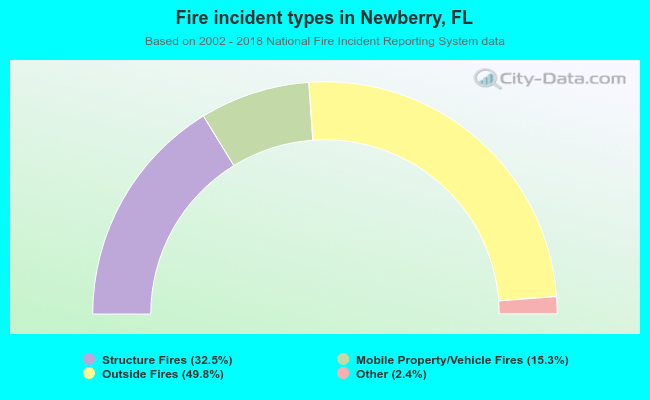 When looking into fire subcategories, the most reports belonged to: Outside Fires (49.8%), and Structure Fires (32.5%).