Newman: Fire Incidents, California (CA)
Where are fire incidents reported in Newman, CA
Something went wrong! Please refresh the page.
|
| |||||||||||||||||||||||||||||||||||||||||||||||||||||||||||||||||||||||||||||||||||||||||||||||||||||||||||||
2005 - 2018 National Fire Incident Reporting System (NFIRS) incidents
- Incident types reported to NFIRS in Newman, CA
- 1,53166.1%Rescue & EMS
- 2279.8%Good Intent Call
- 1647.1%Service Call
- 1355.8%Hazardous Condition
- 1315.7%Fire
- 944.1%False Alarm
- 351.5%Special Incident
- Fire incident types reported to NFIRS in Newman, CA
- 6549.6%Outside Fires
- 3325.2%Structure Fires
- 2216.8%Mobile Property/Vehicle Fires
- 118.4%Other
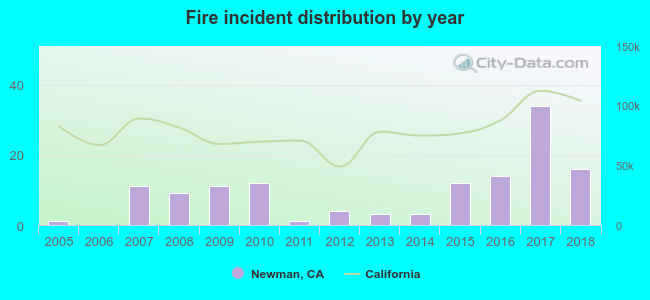 Based on the data from the years 2005 - 2018 the average number of fires per year is 9. The highest number of fires - 34 took place in 2017, and the least - 0 in 2006. The data has a growing trend.
The average number of yearly fire incidents per 10k residents in Newman, CA compared to nearest cities:
(Note: Based on data for the last 3 years, including only cities with population 5,000 and above)
| Newman: | 19.8 |
| Gustine: | 45.7 |
| Patterson: | 45.9 |
| Delhi: | 81.2 |
| Turlock: | 16.4 |
| Livingston: | 21.0 |
| Keyes: | 22.3 |
| Los Banos: | 28.1 |
| Ceres: | 36.3 |
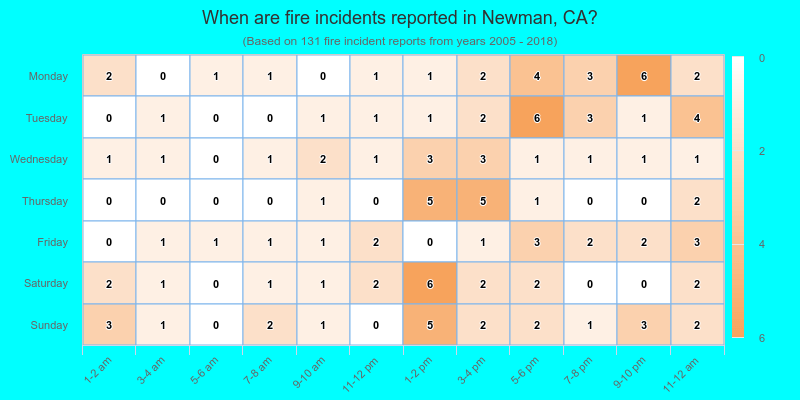
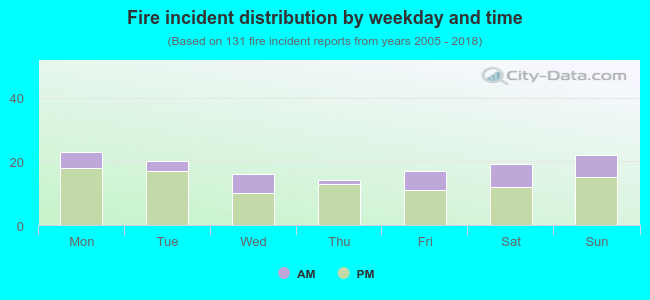 26.7% incidents where reported in the morning and 73.3% in the evening. The most fires (17.6%) took place on Monday, and the least (10.7%) on Thursday.
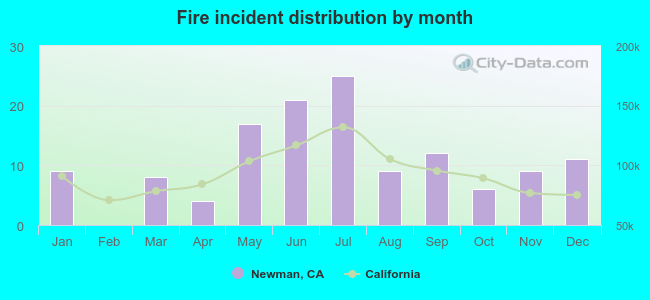 According to the 131 fires from years 2005 - 2018 most fires (19.1%) took place during July, and the least (0.0%) in February.
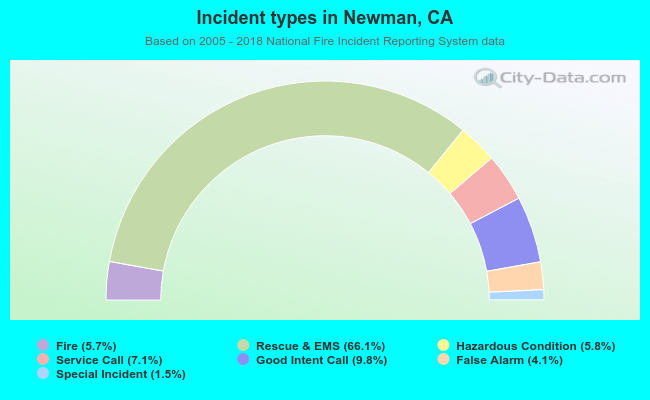 Out of all 2,317 cases reported during the years 2005 - 2018, the most belonged to the categories: Overpressure Rupture (66.1%), Service Call (9.8%), and Hazardous Condition (7.1%).
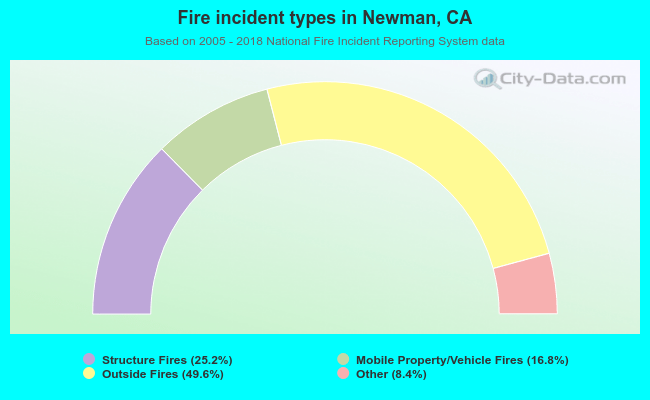 When looking into fire subcategories, the most reports belonged to: Outside Fires (49.6%), and Structure Fires (25.2%).