Newmarket: Fire Incidents, New Hampshire (NH)
Where are fire incidents reported in Newmarket, NH
Something went wrong! Please refresh the page.
|
| |||||||||||||||||||||||||||||||||||||||||||||||||||||||||||||||||||||||||||||||||||||||||||||||||||||||||||||
2002 - 2018 National Fire Incident Reporting System (NFIRS) incidents
- Incident types reported to NFIRS in Newmarket, NH
- 2,71756.4%Rescue & EMS
- 67914.1%Hazardous Condition
- 4389.1%False Alarm
- 3637.5%Service Call
- 3427.1%Fire
- 2234.6%Good Intent Call
- 300.6%Severe Weather
- 200.4%Special Incident
- Fire incident types reported to NFIRS in Newmarket, NH
- 21763.5%Structure Fires
- 9226.9%Outside Fires
- 247.0%Mobile Property/Vehicle Fires
- 92.6%Other
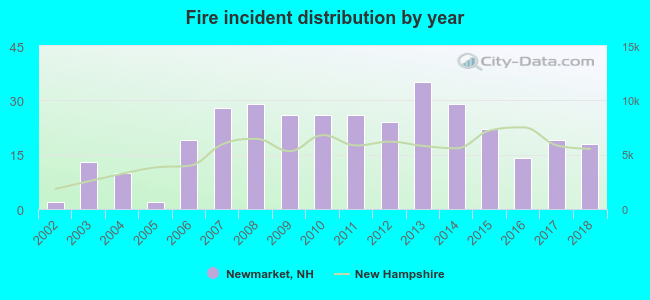 According to the data from the years 2002 - 2018 the average number of fires per year is 20. The highest number of fire incidents - 35 took place in 2013, and the least - 2 in 2002. The data has an increasing trend.
The average number of yearly fire incidents per 10k residents in Newmarket, NH compared to nearest cities:
(Note: Based on data for the last 3 years, including only cities with population 5,000 and above)
| Newmarket: | 32.1 |
| Durham: | 42.2 |
| Stratham: | 53.3 |
| Exeter: | 59.2 |
| Dover: | 27.6 |
| Portsmouth: | 34.1 |
| Barrington: | 30.3 |
| Rye: | 37.8 |
| Hampton: | 65.2 |
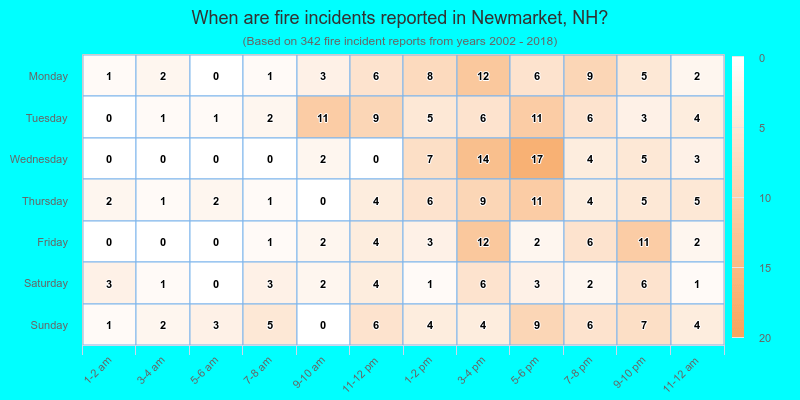
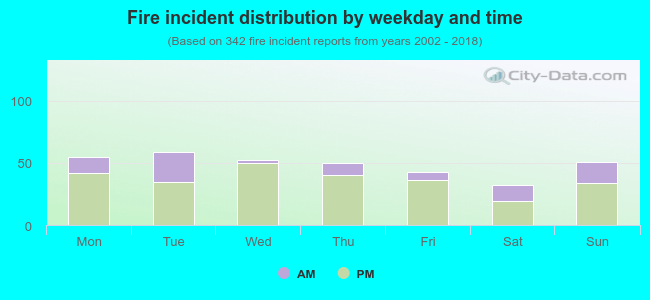 25.1% incidents where reported in the morning and 74.9% in the evening. The most fires (17.3%) took place on Tuesday, and the least (9.4%) on Saturday.
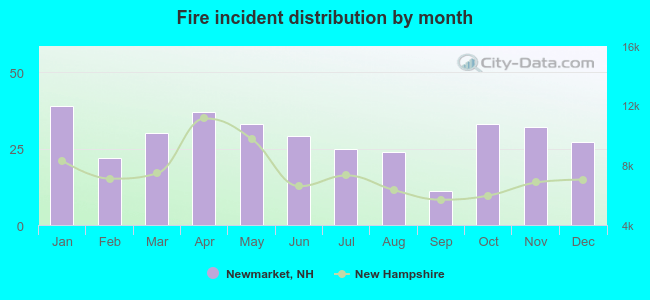 According to the 342 incident reports from years 2002 - 2018 most fires (11.4%) took place during January, and the least (3.2%) in September.
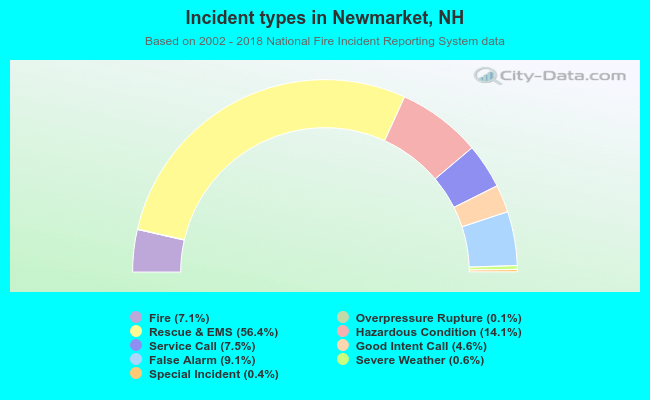 Out of all 4,816 cases reported during the years 2002 - 2018, the most belonged to the categories: Rescue & EMS (56.4%), Hazardous Condition (14.1%), and False Alarm (9.1%).
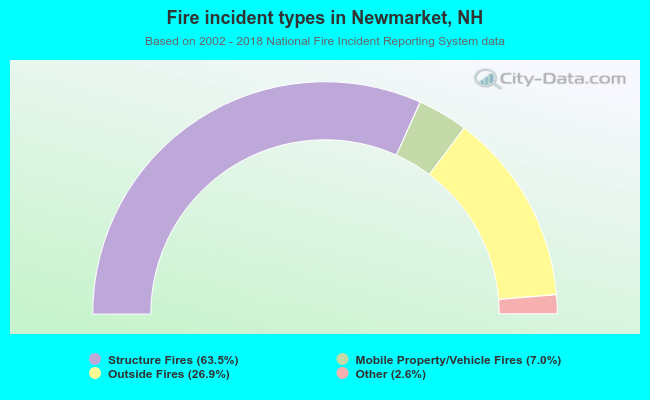 When looking into fire subcategories, the most reports belonged to: Structure Fires (63.5%), and Outside Fires (26.9%).