Newtown: Fire Incidents, Connecticut (CT)
Where are fire incidents reported in Newtown, CT
Something went wrong! Please refresh the page.
| Fire incidents reported | |
|---|---|
| Sreet name | Count |
| MAIN ST | 114 |
| SOUTH MAIN | 54 |
| 84 WEST | 52 |
| CHURCH HILL RD | 38 |
| NUNNAWAUK RD | 36 |
| MT PLEASANT RD | 30 |
| TODDY HILL RD | 28 |
| HANOVER RD | 26 |
| MAIN | 26 |
| SOUTH MAIN ST | 26 |
| 84 EAST | 22 |
| CASTLE HILL RD | 22 |
| HUNTINGTOWN RD | 22 |
| SUGAR ST | 22 |
| BOGGS HILL RD | 20 |
| MARLIN RD | 20 |
| BOULEVARD | 18 |
| CURRITUCK RD | 18 |
| HATTERTOWN RD | 18 |
| HIGH ROCK RD | 18 |
| TAUNTON LAKE RD | 18 |
| DODGINGTOWN RD | 16 |
| TAUNTON HILL RD | 16 |
| BOTSFORD HILL RD | 12 |
| BUTTERFIELD RD | 12 |
| EDEN HILL RD | 12 |
| EDMOND RD | 12 |
| ELM DR | 12 |
| HIGH BRIDGE RD | 12 |
| POVERTY HOLLOW RD | 12 |
2004 - 2018 National Fire Incident Reporting System (NFIRS) incidents
- Incident types reported to NFIRS in Newtown, CT
- 2,57037.5%Hazardous Condition
- 1,02014.9%Good Intent Call
- 90313.2%Service Call
- 80411.7%False Alarm
- 79111.6%Rescue & EMS
- 71910.5%Fire
- 280.4%Special Incident
- Fire incident types reported to NFIRS in Newtown, CT
- 32645.3%Structure Fires
- 24233.7%Outside Fires
- 12917.9%Mobile Property/Vehicle Fires
- 223.1%Other
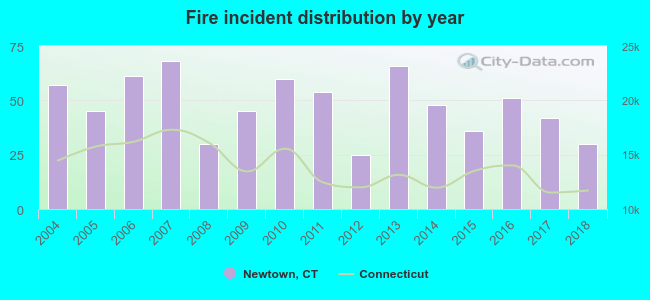 Based on the data from the years 2004 - 2018 the average number of fire incidents per year is 48. The highest number of fire incidents - 68 took place in 2007, and the least - 25 in 2012. The data has a decreasing trend.
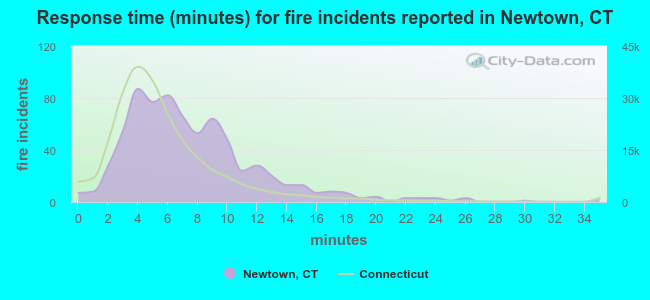 The median response time based on all reported fire incidents is 7 minutes. This is higher compared to the state median value.
The median response time in Newtown, CT compared to nearest cities:
(Note: Based on data for all years, including only cities with at least 500 fire incidents)
| Newtown: | 7 minutes |
| Brookfield: | 6 minutes |
| Southbury: | 5 minutes |
| Bethel: | 6 minutes |
| Monroe: | 6 minutes |
| Danbury: | 5 minutes |
| Redding: | 7 minutes |
| Oxford: | 6 minutes |
| New Fairfield: | 7 minutes |
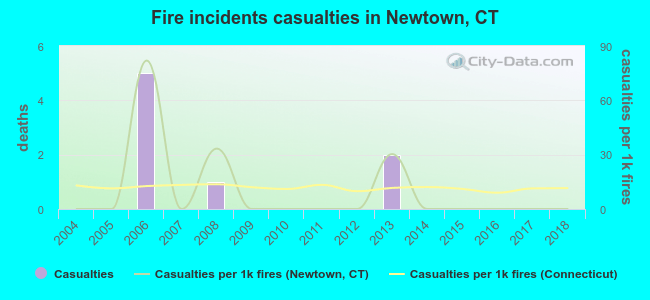 According to the reports from the years 2004 - 2018 the average number of fire-related casualties per year is 1. The highest number of reported injuries - 5 took place in 2006, and the lowest - 0 in 2004. The data has a constant trend.
The average number of casualties per 1,000 fires is 10. This indicator was the highest - 82 in 2006, and the lowest 0 in 2004. The trend for casualties per 1,000 incidents is constant. Compared to the Connecticut value the number of casualties per 1,000 fire incidents is about the same.
According to the reports from the years 2004 - 2018 the average number of fire-related casualties per year is 1. The highest number of reported injuries - 5 took place in 2006, and the lowest - 0 in 2004. The data has a constant trend.
The average number of casualties per 1,000 fires is 10. This indicator was the highest - 82 in 2006, and the lowest 0 in 2004. The trend for casualties per 1,000 incidents is constant. Compared to the Connecticut value the number of casualties per 1,000 fire incidents is about the same.Casualties per 1,000 incidents in Newtown, CT compared to nearest cities:
(Note: Based on data for all years, including only cities with at least 500 fire incidents)
| Newtown: | 11.1 |
| Brookfield: | 5.9 |
| Southbury: | 4.1 |
| Bethel: | 10.8 |
| Monroe: | 3.6 |
| Danbury: | 20.3 |
| Redding: | 9.8 |
| Oxford: | 17.3 |
| New Fairfield: | 14.3 |
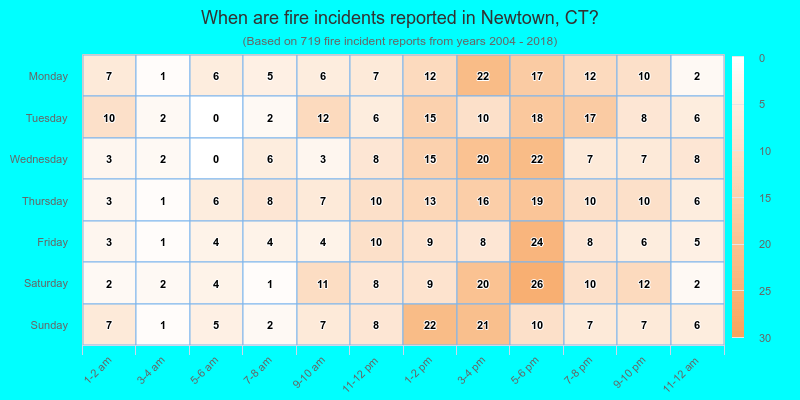
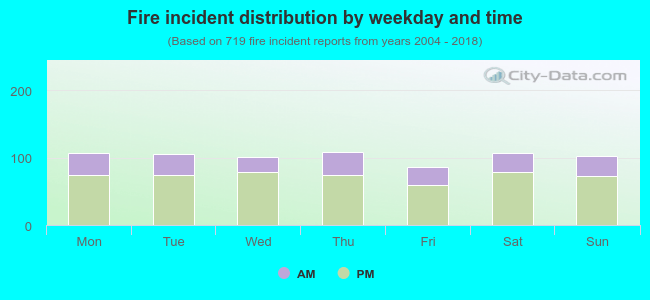 28.5% incidents where reported in the morning and 71.5% in the evening. The most fires (15.2%) took place on Thursday, and the least (12.0%) on Friday.
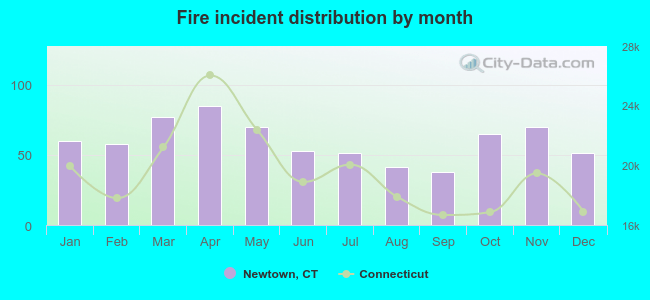 Based on the 719 reports from years 2004 - 2018 most fires (11.8%) took place during April, and the least (5.3%) in September.
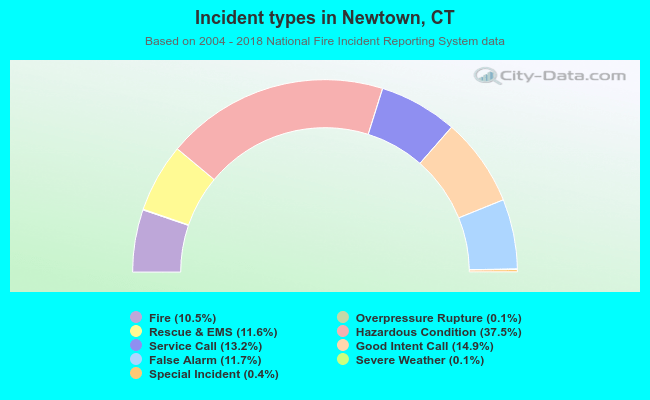 Out of all 6,845 cases reported during the years 2004 - 2018, the most belonged to the categories: Hazardous Condition (37.5%), Good Intent Call (14.9%), and Service Call (13.2%).
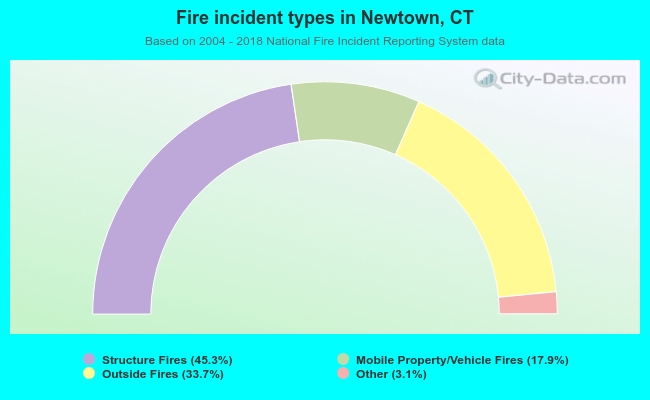 When looking into fire subcategories, the most incidents belonged to: Structure Fires (45.3%), and Outside Fires (33.7%).