Nolanville: Fire Incidents, Texas (TX)
Where are fire incidents reported in Nolanville, TX
Something went wrong! Please refresh the page.
|
| |||||||||||||||||||||||||||||||||||||||||||||||||||||||||||||||||||||||||||||||||||||||||||||||||||||||||||||
2002 - 2018 National Fire Incident Reporting System (NFIRS) incidents
- Incident types reported to NFIRS in Nolanville, TX
- 1,41359.5%Rescue & EMS
- 41417.4%Fire
- 2128.9%Good Intent Call
- 1646.9%Hazardous Condition
- 662.8%Service Call
- 512.1%False Alarm
- 492.1%Special Incident
- 30.1%Overpressure Rupture
- Fire incident types reported to NFIRS in Nolanville, TX
- 21752.4%Outside Fires
- 10425.1%Structure Fires
- 6816.4%Mobile Property/Vehicle Fires
- 256.0%Other
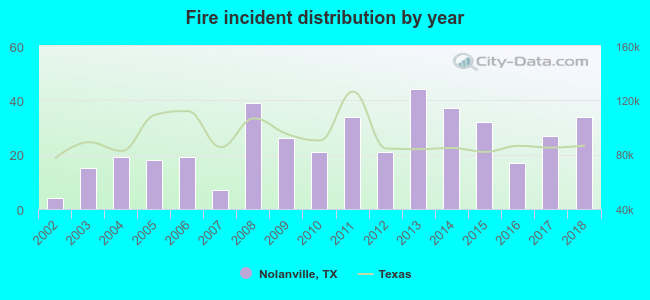 According to the data from the years 2002 - 2018 the average number of fire incidents per year is 24. The highest number of reported fires - 44 took place in 2013, and the least - 4 in 2002. The data has a growing trend.
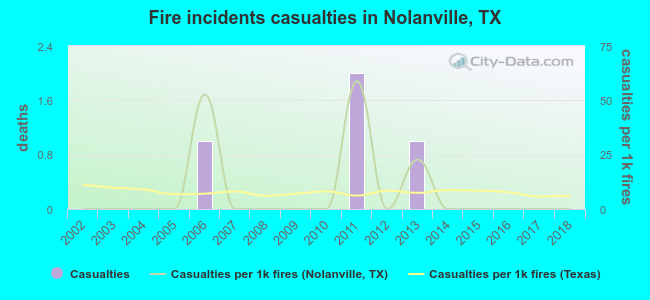 Based on the reports from the years 2002 - 2018 the average number of fire-related casualties per year is 0. The highest number of injuries - 2 took place in 2011, and the lowest - 0 in 2002. The data has a constant trend.
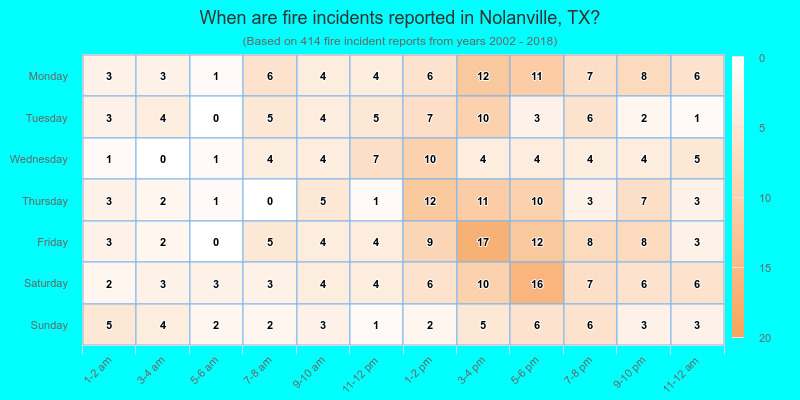
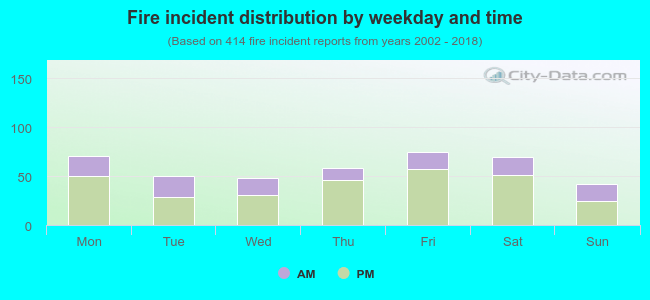 30.2% incidents where reported in the morning and 69.8% in the evening. The most fires (18.1%) took place on Friday, and the least (10.1%) on Sunday.
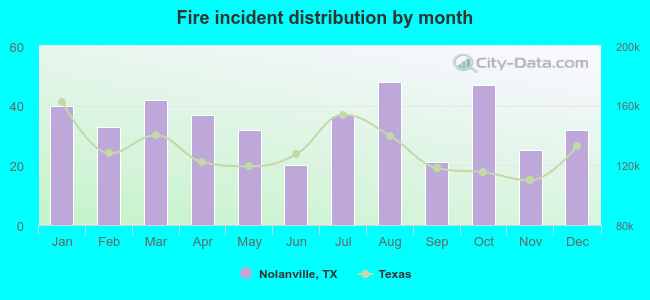 Based on the 414 reports from years 2002 - 2018 most fires (11.6%) took place during August, and the least (4.8%) in June.
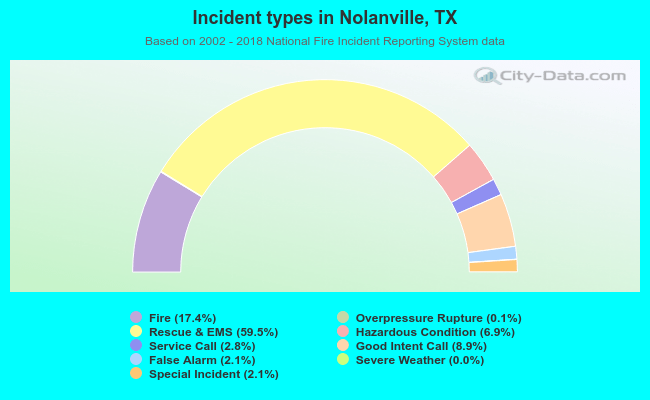 Out of all 2,373 cases reported during the years 2002 - 2018, the most belonged to the categories: Rescue & EMS (59.5%), Fire (17.4%), and Good Intent Call (8.9%).
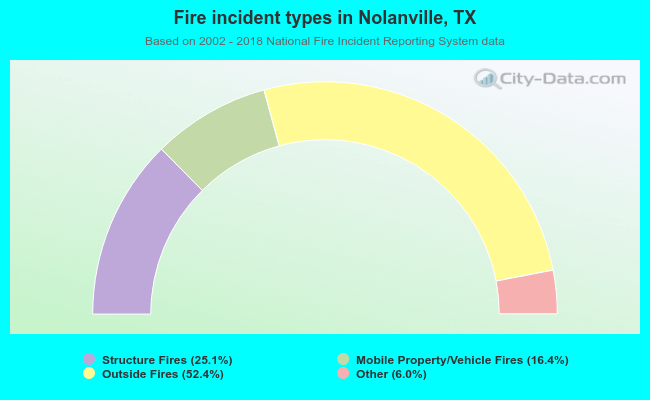 When looking into fire subcategories, the most incidents belonged to: Outside Fires (52.4%), and Structure Fires (25.1%).