North Braddock: Fire Incidents, Pennsylvania (PA)
Where are fire incidents reported in North Braddock, PA
Something went wrong! Please refresh the page.
|
| |||||||||||||||||||||||||||||||||||||||||||||||||||||||||||||||||||||||||||||||||||||||||||||||||||||||||||||
2004 - 2018 National Fire Incident Reporting System (NFIRS) incidents
- Incident types reported to NFIRS in North Braddock, PA
- 28025.9%Fire
- 26524.5%Hazardous Condition
- 18116.8%Good Intent Call
- 16715.5%False Alarm
- 1009.3%Rescue & EMS
- 847.8%Service Call
- 20.2%Special Incident
- Fire incident types reported to NFIRS in North Braddock, PA
- 20171.8%Structure Fires
- 4114.6%Outside Fires
- 227.9%Mobile Property/Vehicle Fires
- 165.7%Other
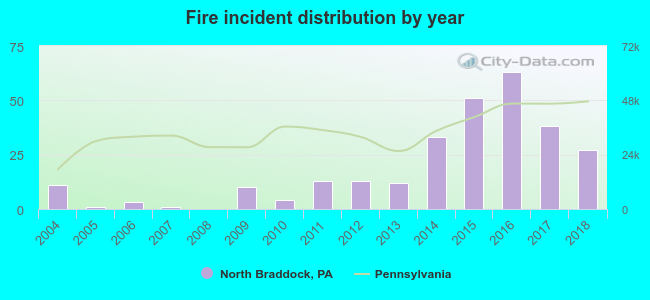 According to the data from the years 2004 - 2018 the average number of fires per year is 19. The highest number of reported fire incidents - 63 took place in 2016, and the least - 0 in 2008. The data has an increasing trend.
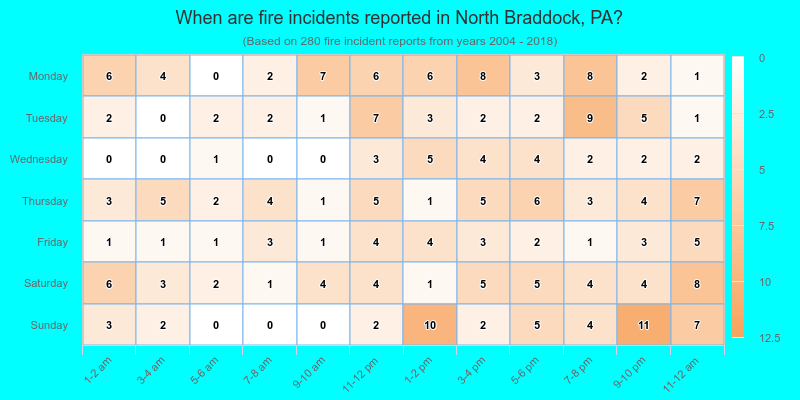
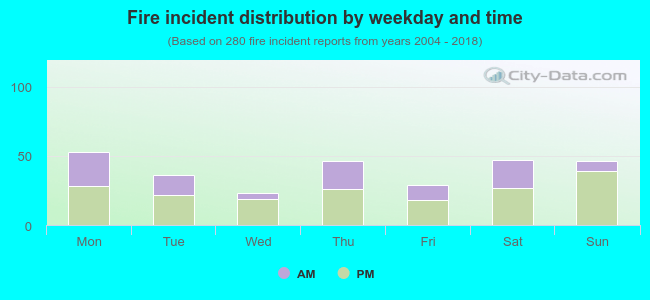 36.1% incidents where reported in the morning and 63.9% in the evening. The most fires (18.9%) took place on Monday, and the least (8.2%) on Wednesday.
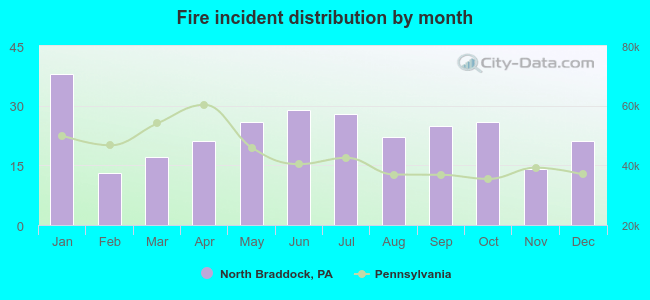 According to the 280 incident reports from years 2004 - 2018 most fires (13.6%) took place during January, and the least (4.6%) in February.
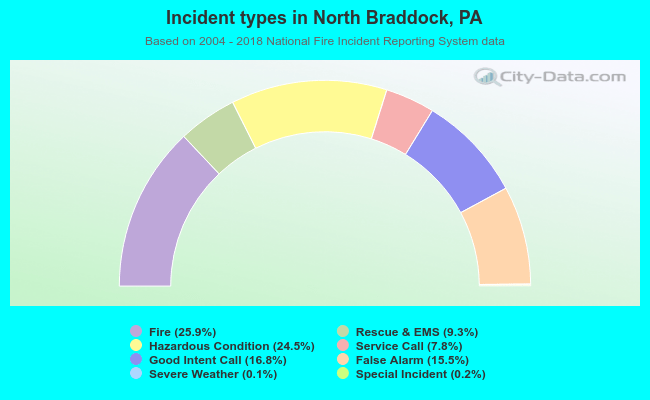 Out of all 1,080 cases reported during the years 2004 - 2018, the most belonged to the categories: Fire (25.9%), Rescue & EMS (24.5%), and Service Call (16.8%).
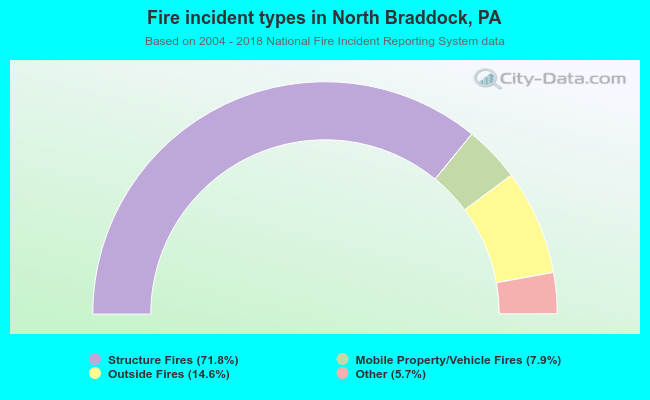 When looking into fire subcategories, the most incidents belonged to: Structure Fires (71.8%), and Outside Fires (14.6%).