North Sioux City: Fire Incidents, South Dakota (SD)
Where are fire incidents reported in North Sioux City, SD
Something went wrong! Please refresh the page.
|
| |||||||||||||||||||||||||||||||||||||||||||||||||||||||||||||||||||||||||||||||||||||||||||||
2003 - 2018 National Fire Incident Reporting System (NFIRS) incidents
- Incident types reported to NFIRS in North Sioux City, SD
- 11231.9%Fire
- 8423.9%False Alarm
- 8022.8%Hazardous Condition
- 3710.5%Rescue & EMS
- 216.0%Service Call
- 144.0%Good Intent Call
- 20.6%Severe Weather
- 10.3%Overpressure Rupture
- Fire incident types reported to NFIRS in North Sioux City, SD
- 5952.7%Outside Fires
- 2925.9%Mobile Property/Vehicle Fires
- 1715.2%Structure Fires
- 76.3%Other
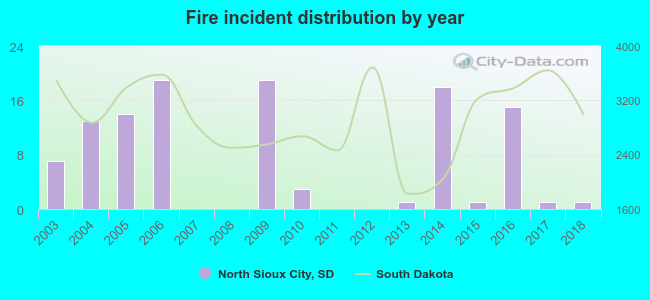 Based on the data from the years 2003 - 2018 the average number of fires per year is 7. The highest number of reported fire incidents - 19 took place in 2006, and the least - 0 in 2007. The data has a dropping trend.
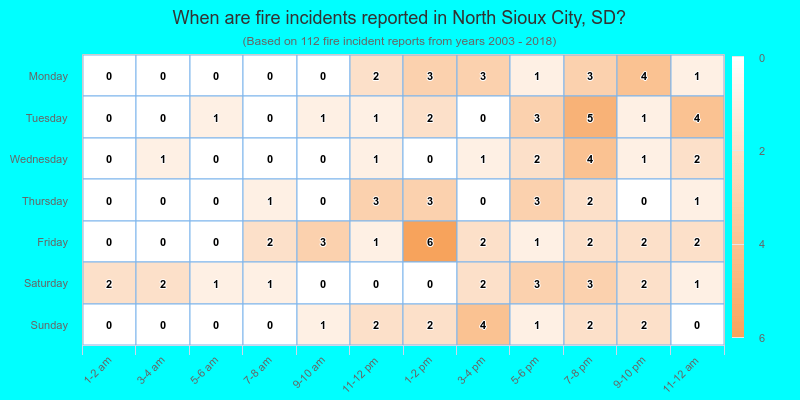
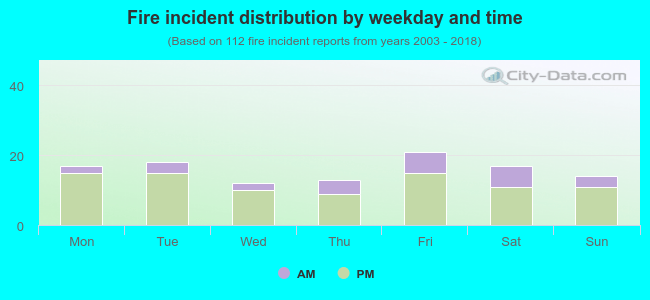 23.2% incidents where reported in the morning and 76.8% in the evening. The most fires (18.8%) took place on Friday, and the least (10.7%) on Wednesday.
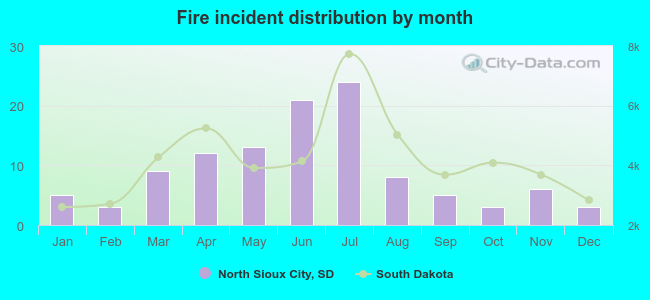 Based on the 112 fires from years 2003 - 2018 most fires (21.4%) took place during July, and the least (2.7%) in February.
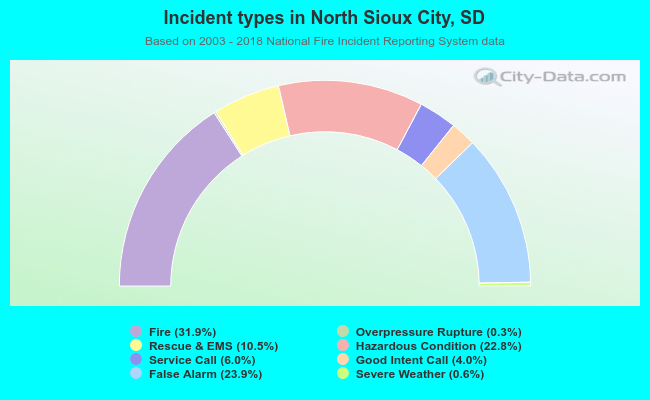 Out of all 351 cases reported during the years 2003 - 2018, the most belonged to the categories: Fire (31.9%), False Alarm (23.9%), and Hazardous Condition (22.8%).
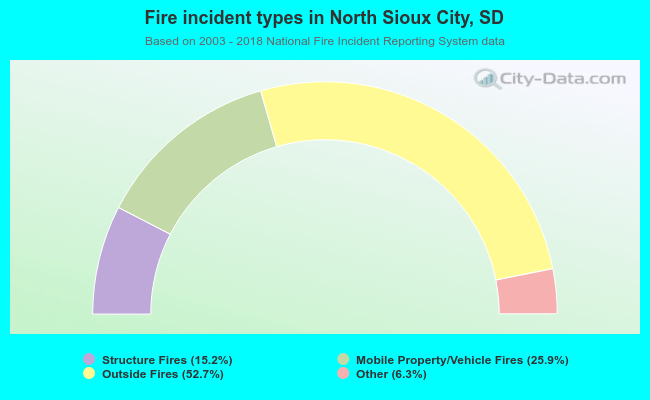 When looking into fire subcategories, the most incidents belonged to: Outside Fires (52.7%), and Mobile Property/Vehicle Fires (25.9%).