| Fire incidents reported |
|---|
| Sreet name | Count |
|---|
| FIRST NEW HAMPSHIRE TPKE | 118 | | FIRST NH TURNPIKE | 40 | | BLAKES HILL RD | 34 | | MAIN ST | 34 | | WEST ST | 30 | | MOUNTAIN AVE | 28 | | CATAMOUNT RD | 26 | | WINDING HILL RD | 26 | | RIDGE RD | 24 | | BOW ST | 22 | | BOW LAKE RD | 20 | | GULF RD | 18 | | HARMONY RD | 18 | | JENNESS POND RD | 18 | | LONG POND RD | 18 | | ROCHESTER RD | 18 | | STRAFFORD RD | 16 | | FIRST NH TPKE | 14 | | OLD MOUNTAIN RD | 14 | | OLDE CANTERBURY RD | 14 | | HARDING DR | 12 | | OLD DUMP RD | 12 | | FIORI RD | 10 | | SUNRISE LN | 10 | | UPPER DEERFIELD RD | 10 |
| | | Fire incidents reported |
|---|
| Sreet name | Count |
|---|
| FIRST NH TP | 8 | | FROST RD | 8 | | LUCAS POND RD | 8 | | MILL POND RD | 8 | | PREVE DR | 8 | | ASH ST | 6 | | BRYANT RD | 6 | | OAK ST | 6 | | OLD TURNPIKE RD | 6 | | PARK AVE | 6 | | ALLEN FARM RD | 4 | | ANGELA DR | 4 | | BLAKES HILL ROAD | 4 | | CATAMOUNT | 4 | | DOVER RD | 4 | | ELM ST | 4 | | FIRST NH | 4 | | FOX CROSS LANE | 4 | | GULF RD | 4 | | HARVEY LAKE RD | 4 | | LAKE SHORE DR | 4 | | LOWER DEERFIELD RD | 4 | | LYNN GROVE RD | 4 | | PINE ST | 4 | | |
|
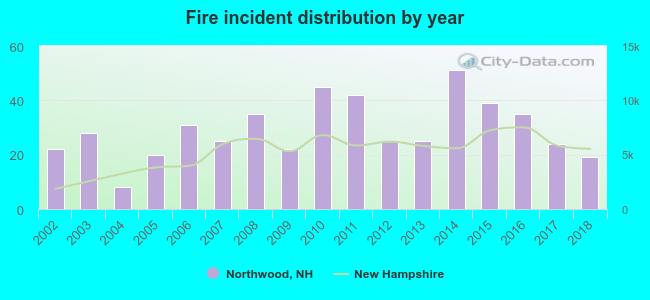 Based on the data from the years 2002 - 2018 the average number of fire incidents per year is 29. The highest number of fires - 51 took place in 2014, and the least - 8 in 2004. The data has a declining trend.
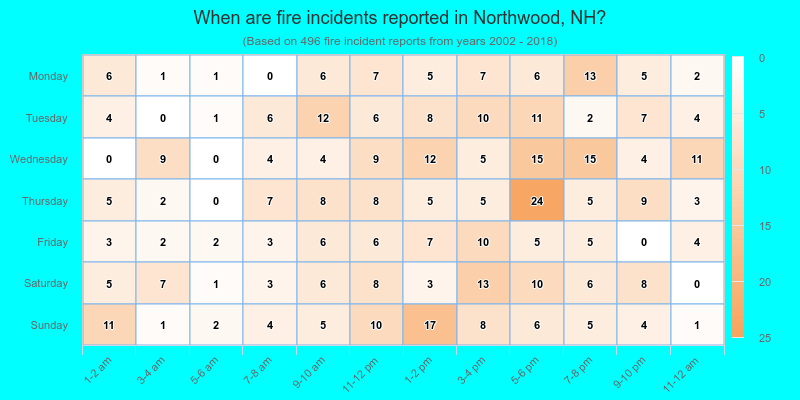
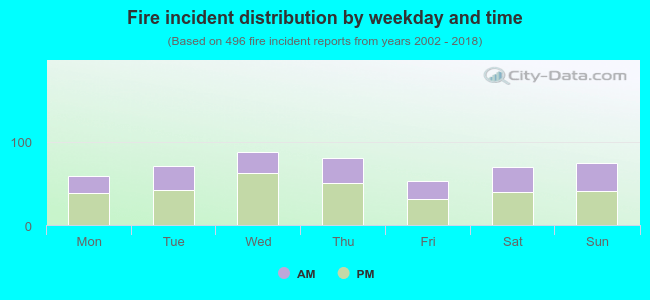 38.5% incidents where reported in the morning and 61.5% in the evening. The most fires (17.7%) took place on Wednesday, and the least (10.7%) on Friday.
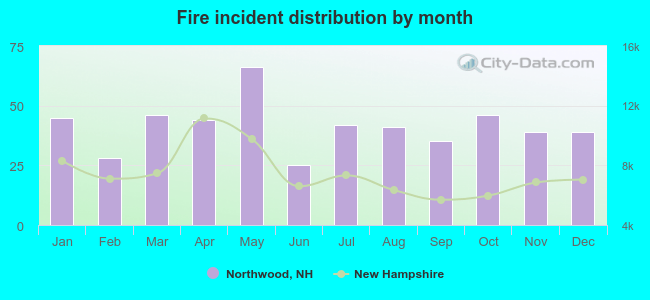 According to the 496 fire incidents from years 2002 - 2018 most fires (13.3%) took place during May, and the least (5.0%) in June.
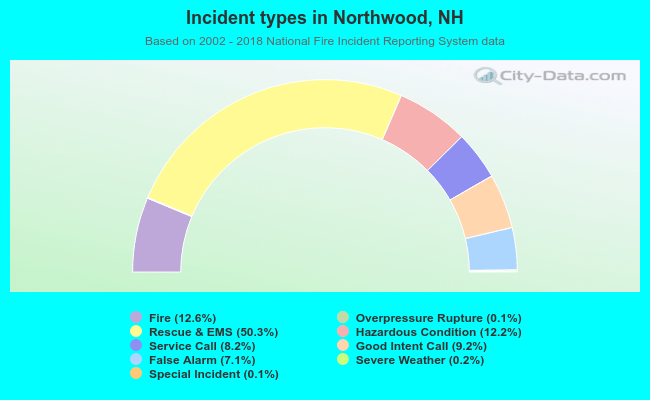 Out of all 3,945 cases reported during the years 2002 - 2018, the most belonged to the categories: Rescue & EMS (50.3%), Fire (12.6%), and Hazardous Condition (12.2%).
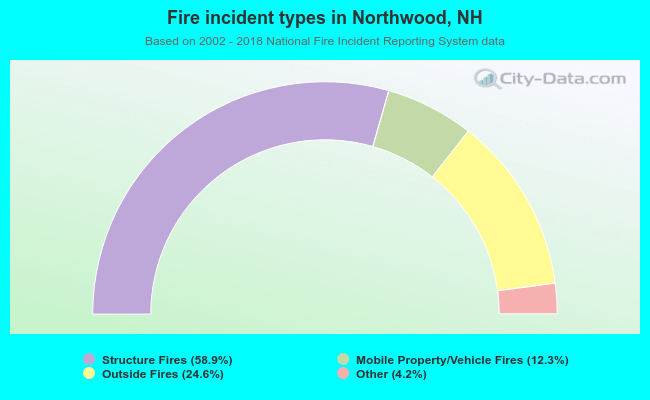 When looking into fire subcategories, the most reports belonged to: Structure Fires (58.9%), and Outside Fires (24.6%).