Oil City: Fire Incidents, Louisiana (LA)
Where are fire incidents reported in Oil City, LA
Something went wrong! Please refresh the page.
|
| |||||||||||||||||||||||||||||||||||||||||||||||||||||||||||||||||||||||||||||||||||||||||||||||||||||||||||||
2002 - 2018 National Fire Incident Reporting System (NFIRS) incidents
- Incident types reported to NFIRS in Oil City, LA
- 62254.4%Rescue & EMS
- 26923.5%Fire
- 948.2%Good Intent Call
- 827.2%Hazardous Condition
- 504.4%Service Call
- 211.8%False Alarm
- 30.3%Special Incident
- Fire incident types reported to NFIRS in Oil City, LA
- 16561.3%Outside Fires
- 8029.7%Structure Fires
- 145.2%Mobile Property/Vehicle Fires
- 103.7%Other
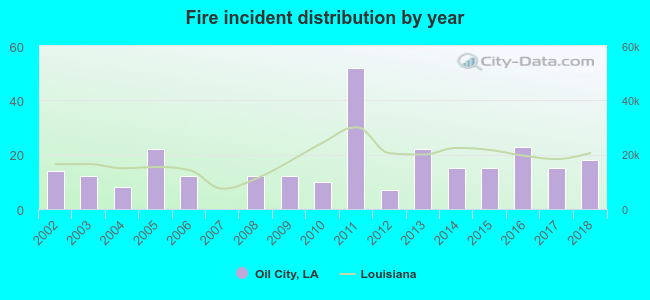 Based on the data from the years 2002 - 2018 the average number of fire incidents per year is 16. The highest number of reported fire incidents - 52 took place in 2011, and the least - 0 in 2007. The data has a rising trend.
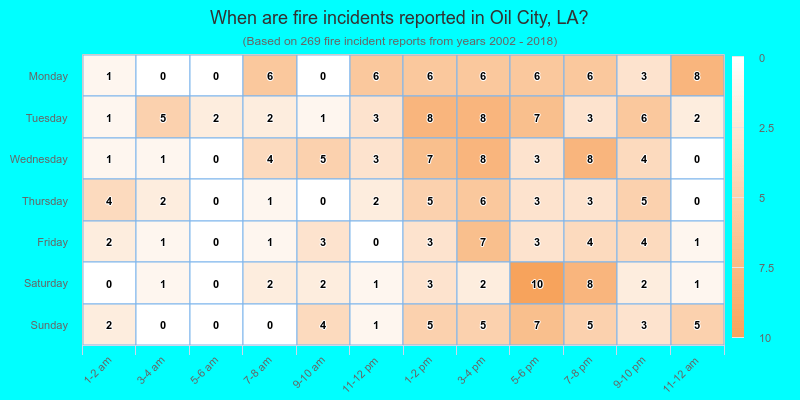
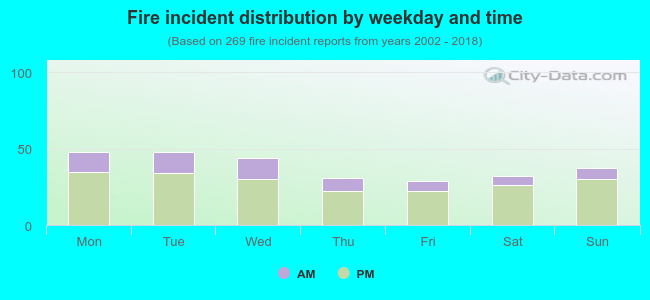 26.0% incidents where reported in the morning and 74.0% in the evening. The most fires (17.8%) took place on Monday, and the least (10.8%) on Friday.
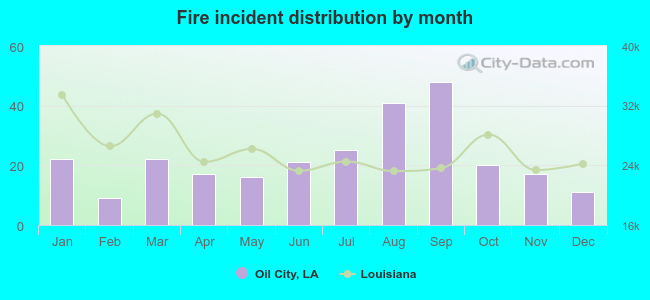 According to the 269 fire incident reports from years 2002 - 2018 most fires (17.8%) took place during September, and the least (3.3%) in February.
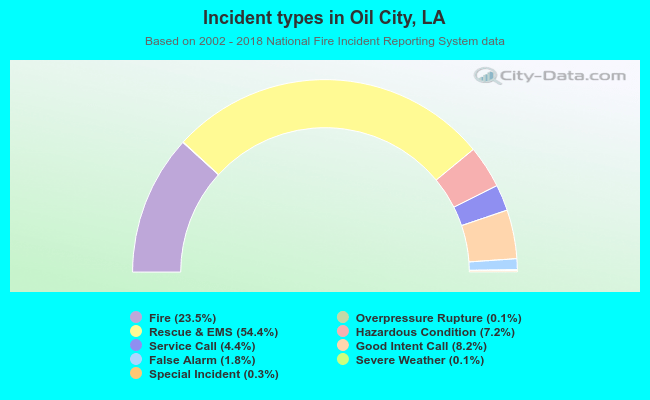 Out of all 1,143 cases reported during the years 2002 - 2018, the most belonged to the categories: Rescue & EMS (54.4%), Fire (23.5%), and Good Intent Call (8.2%).
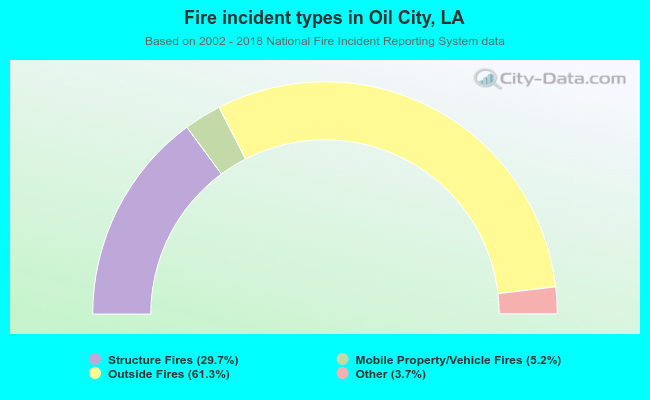 When looking into fire subcategories, the most incidents belonged to: Outside Fires (61.3%), and Structure Fires (29.7%).