| Fire incidents reported |
|---|
| Sreet name | Count |
|---|
| 259 HWY | 18 | | CAMP JOY RD | 10 | | HENRY ST | 10 | | HWY 259 | 8 | | SNAPDRAGON RD | 8 | | DOGWOOD | 6 | | FARM TO MARKET ROAD 1649 | 6 | | HOLMAN ST | 6 | | HWY 259 HWY | 6 | | MAIN ST | 6 | | SH 155 S HWY | 6 | | STATE HIGHWAY 155 | 6 | | WILD ONION RD | 6 | | CYPRESS ST | 4 | | DOGWOOD ST | 4 | | FM 1972 | 4 | | FRONT ST | 4 | | GERANIUM RD | 4 | | HWY 155 NORTH | 4 | | LAKESIDE CIR | 4 | | MAIN | 4 | | OLD AVINGER RD | 4 | | SHELLY RD | 4 | | TRAIL RD | 4 | | US 259 HWY | 4 |
| | | Fire incidents reported |
|---|
| Sreet name | Count |
|---|
| VERBENA RD | 4 | | WISTERIA TRAIL | 4 | | WYSTERIA ST | 4 | | WYSTERIA TRL | 4 | | 10824 VERBINA ROAD RD | 2 | | 12758 SWEET WILLIAMS RD RD | 2 | | 6716 FRONT STREET | 2 | | 7995 GLENN DR | 2 | | 918 VIOLET RD | 2 | | ARTHUR ST | 2 | | AUTHOR ST | 2 | | AUTHUR RD | 2 | | AUTHUR ST | 2 | | CALADIUM ST | 2 | | CAMP JOY ST | 2 | | CONTINENTAL ST | 2 | | CORNER OF NORTH CYPRESS AND EA | 2 | | COUNTY OF UPSHUR | 2 | | CRYSTAL | 2 | | DEVILLE RD | 2 | | EAST MAIN STREET | 2 | | ELM CUT OFF RD | 2 | | FM 450 | 2 | | FM 1972 HWY | 2 | | |
|
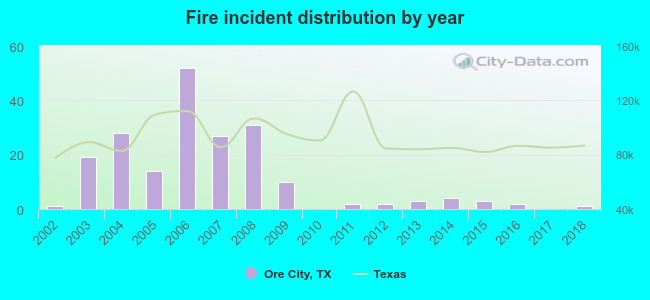 Based on the data from the years 2002 - 2018 the average number of fires per year is 12. The highest number of reported fire incidents - 52 took place in 2006, and the least - 0 in 2010. The data has a constant trend.
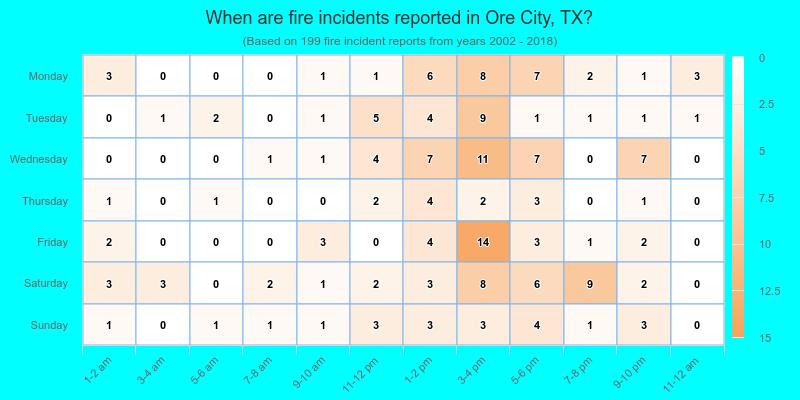
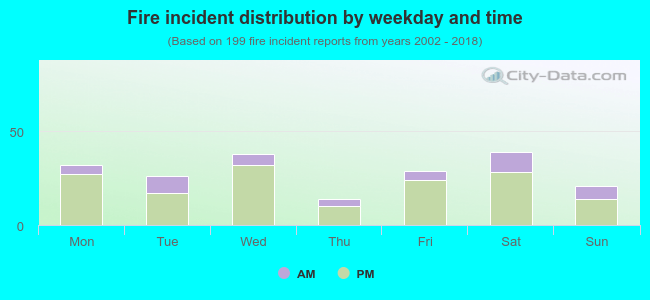 23.6% incidents where reported in the morning and 76.4% in the evening. The most fires (19.6%) took place on Saturday, and the least (7.0%) on Thursday.
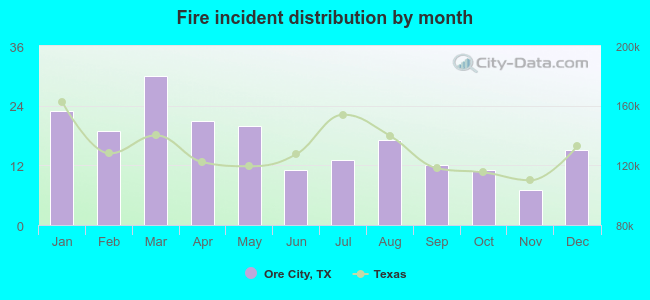 Based on the 199 fire incident reports from years 2002 - 2018 most fires (15.1%) took place during March, and the least (3.5%) in November.
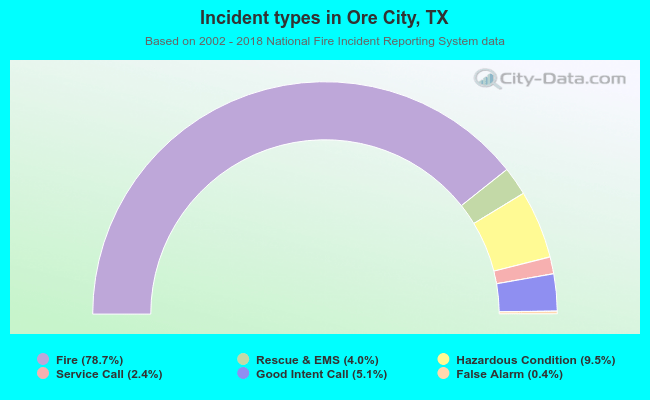 Out of all 253 cases reported during the years 2002 - 2018, the most belonged to the categories: Fire (78.7%), Rescue & EMS (9.5%), and Service Call (5.1%).
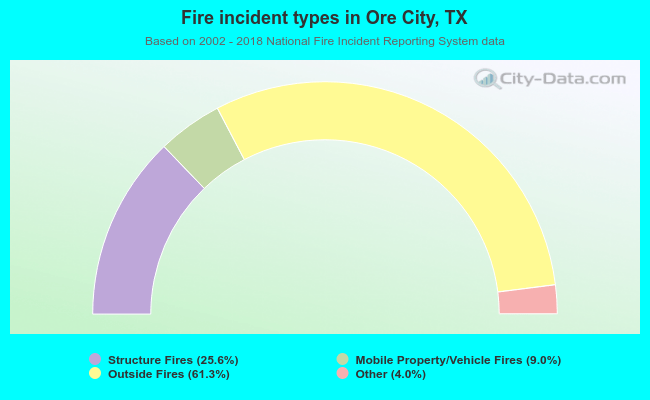 When looking into fire subcategories, the most reports belonged to: Outside Fires (61.3%), and Structure Fires (25.6%).