| Fire incidents reported |
|---|
| Sreet name | Count |
|---|
| RICHMOND ROAD | 34 | | RICHMOND RD | 32 | | GILLESPIE PIKE | 22 | | WHITE LICK RD | 22 | | WHITE LICK ROAD | 20 | | CARTERSVILLE ROAD | 14 | | BROCK RD | 12 | | CARTERSVILLE RD | 12 | | DOTY LANE | 10 | | MORAN SUMMITT RD | 10 | | NARROW GAP RD | 10 | | OLD RICHMOND ROAD | 10 | | CATERSVILLE ROAD | 8 | | HWY 52 | 8 | | MORAN SUMMIT RD | 8 | | WALKER PIKE | 8 | | COPPER CREEK RD | 6 | | HARMONS LICK RD | 6 | | HIGHWAY 52 | 6 | | HURT LANE | 6 | | LANCASTER RD | 6 | | OLD RAILROAD | 6 | | WALLACE MILL RD | 6 | | BROCK ROAD | 4 | | CHARLIE BROWN | 4 |
| | | Fire incidents reported |
|---|
| Sreet name | Count |
|---|
| DRIPPING SPRINGS | 4 | | GILLESPIE PIKE | 4 | | HARMONS LICK ROAD | 4 | | LAMB ROAD | 4 | | LEE JOHNSON ROAD | 4 | | NOE ROAD | 4 | | PEGGY FLATS RD | 4 | | SAM HENDERSON RD | 4 | | US 1295 HWY | 4 | | US 52 HWY | 4 | | WILSON LANE | 4 | | 1295 | 2 | | 1524 OLD RICHMOND ROAD | 2 | | BELL LANE | 2 | | BROADDUS BRANCH | 2 | | BROADUS BRANCH ROAD | 2 | | BRUSHY FORK RD | 2 | | CARTERSVILLE ROAD | 2 | | CARTERSVILLE AND COPPER RD | 2 | | CEMETERY RD | 2 | | CHARLIE BROWN ROAD | 2 | | COLLEGE HILL RD | 2 | | DRAKES CREEK RD | 2 | | FROG BRANCH RD | 2 | | |
|
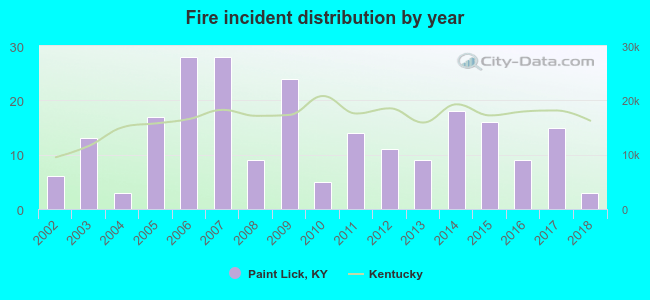 According to the data from the years 2002 - 2018 the average number of fire incidents per year is 13. The highest number of fire incidents - 28 took place in 2006, and the least - 3 in 2004. The data has a declining trend.
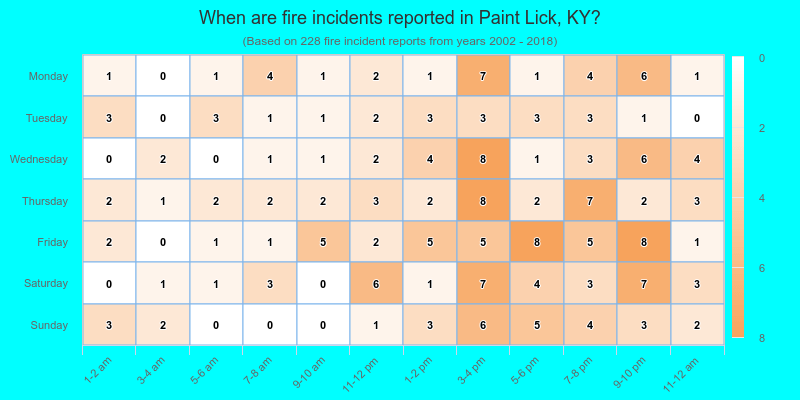
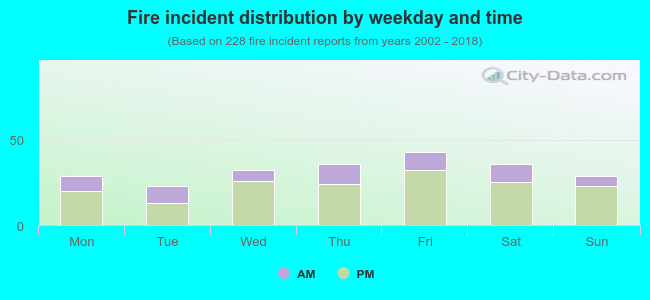 28.5% incidents where reported in the morning and 71.5% in the evening. The most fires (18.9%) took place on Friday, and the least (10.1%) on Tuesday.
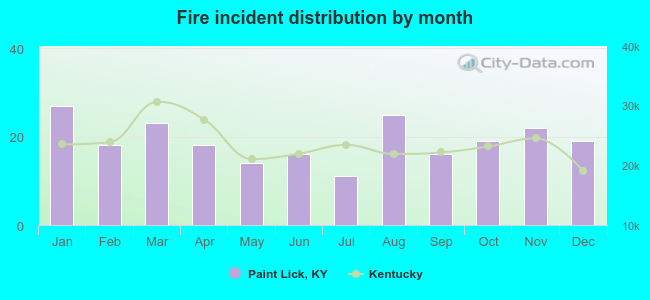 According to the 228 reports from years 2002 - 2018 most fires (11.8%) took place during January, and the least (4.8%) in July.
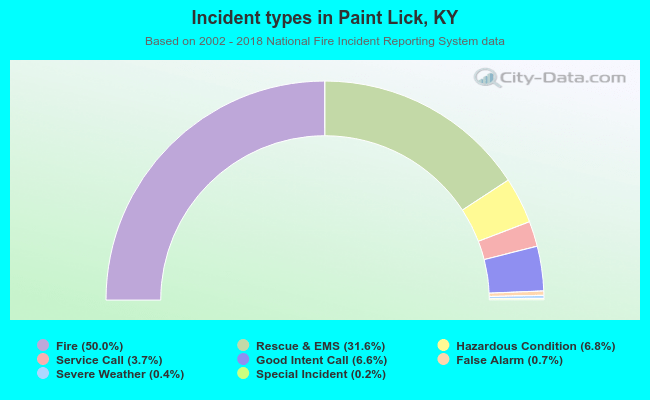 Out of all 456 cases reported during the years 2002 - 2018, the most belonged to the categories: Fire (50.0%), Overpressure Rupture (31.6%), and Rescue & EMS (6.8%).
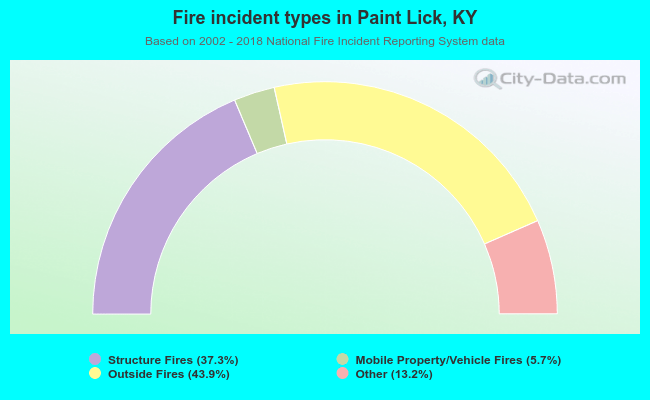 When looking into fire subcategories, the most incidents belonged to: Outside Fires (43.9%), and Structure Fires (37.3%).