Palm Harbor: Fire Incidents, Florida (FL)
Where are fire incidents reported in Palm Harbor, FL
Something went wrong! Please refresh the page.
| Fire incidents reported | |
|---|---|
| Sreet name | Count |
| US 19 HWY | 596 |
| ALT 19 | 164 |
| TAMPA RD | 108 |
| KATHERINE BLVD | 94 |
| NEBRASKA AVE | 84 |
| US 19 N HWY | 70 |
| EAST LAKE RD | 66 |
| ALDERMAN RD | 64 |
| CURLEW RD | 62 |
| LAKE SHORE DR | 50 |
| LAKE GEORGE DR | 48 |
| SEAGULL DR | 44 |
| TARPON WOODS BLVD | 40 |
| ORANGE ST | 38 |
| OMAHA ST | 34 |
| CYPRESS POND RD | 30 |
| TAMPA RD-PH | 28 |
| WEST LAKE RD | 28 |
| ALT 19-PH | 26 |
| BELCHER RD-PH | 26 |
| CLUBSIDE CT | 26 |
| CORAL LANDINGS BLVD | 26 |
| TALLEY DR | 26 |
| 19 ST | 24 |
| BAY HARBOR DR | 24 |
| BONAVENTURE CIR | 22 |
| PENNSYLVANIA AVE | 20 |
| RIDGEMOOR CIR | 20 |
| STAG THICKET LN | 20 |
| US HWY 19 | 20 |
| Other | 499 |
2005 - 2018 National Fire Incident Reporting System (NFIRS) incidents
- Incident types reported to NFIRS in Palm Harbor, FL
- 27,71268.6%Rescue & EMS
- 5,69814.1%Good Intent Call
- 2,4276.0%Fire
- 1,8594.6%False Alarm
- 1,8344.5%Hazardous Condition
- 7801.9%Service Call
- 410.1%Overpressure Rupture
- Fire incident types reported to NFIRS in Palm Harbor, FL
- 1,31154.0%Structure Fires
- 68628.3%Outside Fires
- 25010.3%Mobile Property/Vehicle Fires
- 1807.4%Other
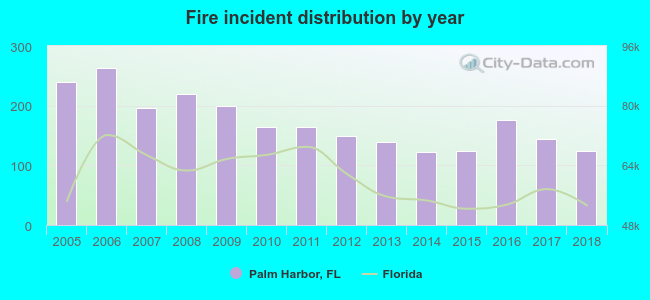 Based on the data from the years 2005 - 2018 the average number of fire incidents per year is 173. The highest number of reported fire incidents - 263 took place in 2006, and the least - 122 in 2014. The data has a decreasing trend.
The average number of yearly fire incidents per 10k residents in Palm Harbor, FL compared to nearest cities:
(Note: Based on data for the last 3 years, including only cities with population 5,000 and above)
| Palm Harbor: | 25.8 |
| East Lake: | 0.3 |
| Dunedin: | 21.9 |
| Tarpon Springs: | 50.2 |
| Oldsmar: | 49.8 |
| Safety Harbor: | 19.7 |
| Holiday: | 35.6 |
| Clearwater: | 44.1 |
| Trinity: | 3.7 |
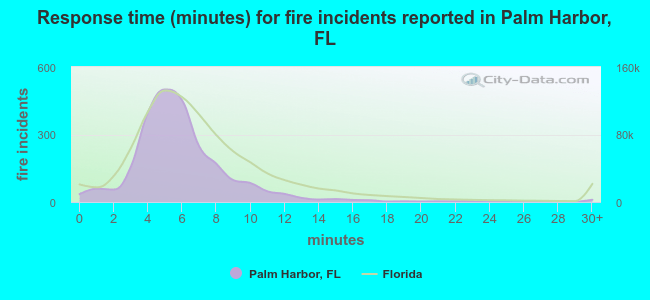 The median response time based on all reported fire incidents is 6 minutes. This is similar to the state median value.
The median response time in Palm Harbor, FL compared to nearest cities:
(Note: Based on data for all years, including only cities with at least 500 fire incidents)
| Palm Harbor: | 6 minutes |
| Dunedin: | 5 minutes |
| Tarpon Springs: | 6 minutes |
| Oldsmar: | 6 minutes |
| Safety Harbor: | 5 minutes |
| Holiday: | 6 minutes |
| Clearwater: | 5 minutes |
| New Port Richey: | 6 minutes |
| Largo: | 5 minutes |
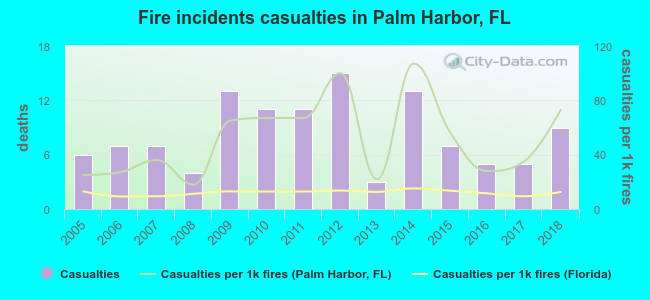 According to the reports from the years 2005 - 2018 the average number of fire-related yearly casualties is 8. The highest number of reported injuries - 15 took place in 2012, and the lowest - 3 in 2013. The data has a growing trend.
The average number of casualties per 1,000 fire incidents is 52. This indicator was the highest - 107 in 2014, and the lowest 18 in 2008. The trend for injuries per 1,000 fires is growing. Compared to the state value the number of casualties per 1,000 incidents is much higher.
According to the reports from the years 2005 - 2018 the average number of fire-related yearly casualties is 8. The highest number of reported injuries - 15 took place in 2012, and the lowest - 3 in 2013. The data has a growing trend.
The average number of casualties per 1,000 fire incidents is 52. This indicator was the highest - 107 in 2014, and the lowest 18 in 2008. The trend for injuries per 1,000 fires is growing. Compared to the state value the number of casualties per 1,000 incidents is much higher.Casualties per 1,000 incidents in Palm Harbor, FL compared to nearest cities:
(Note: Based on data for all years, including only cities with at least 500 fire incidents)
| Palm Harbor: | 47.8 |
| Dunedin: | 55.1 |
| Tarpon Springs: | 26.3 |
| Oldsmar: | 11.4 |
| Safety Harbor: | 48.0 |
| Holiday: | 46.5 |
| Clearwater: | 49.9 |
| New Port Richey: | 25.6 |
| Largo: | 89.9 |
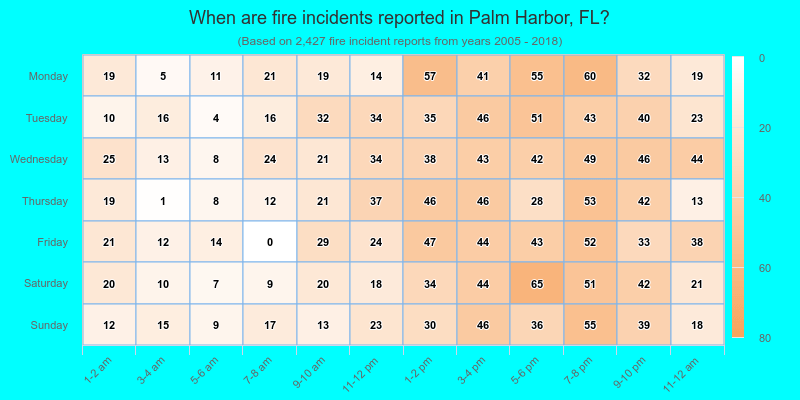
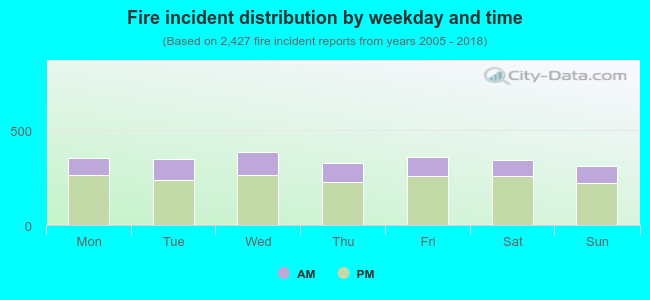 28.7% incidents where reported in the morning and 71.3% in the evening. The most fires (15.9%) took place on Wednesday, and the least (12.9%) on Sunday.
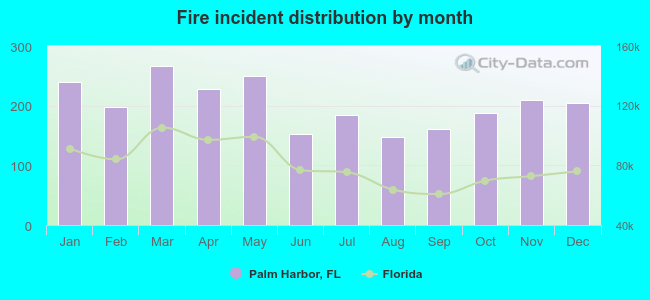 According to the 2,427 fires from years 2005 - 2018 most fires (11.0%) took place during March, and the least (6.1%) in August.
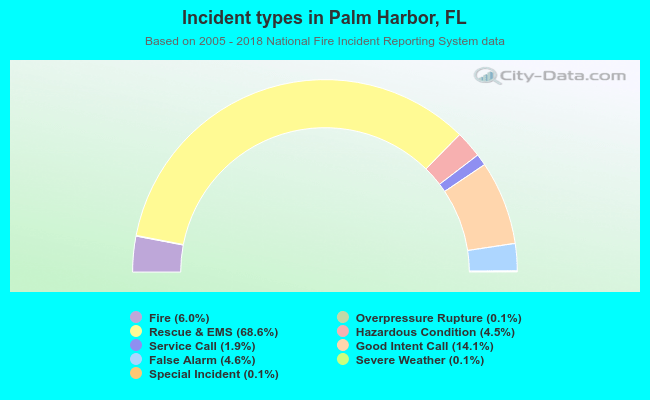 Out of all 40,410 cases reported during the years 2005 - 2018, the most belonged to the categories: Rescue & EMS (68.6%), Good Intent Call (14.1%), and Fire (6.0%).
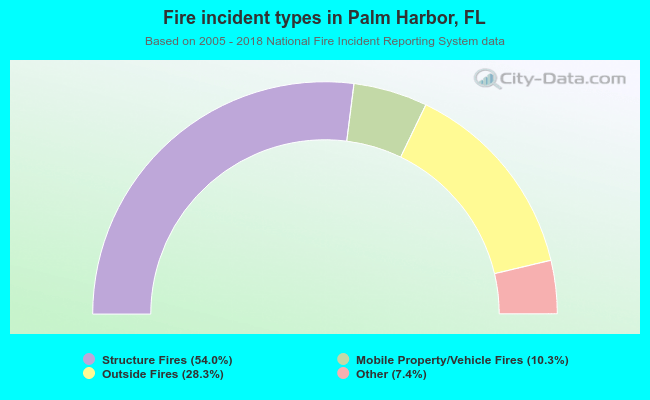 When looking into fire subcategories, the most reports belonged to: Structure Fires (54.0%), and Outside Fires (28.3%).