Palm Springs: Fire Incidents, California (CA)
Where are fire incidents reported in Palm Springs, CA
Something went wrong! Please refresh the page.
| Fire incidents reported | |
|---|---|
| Sreet name | Count |
| PALM CANYON DR | 658 |
| INDIAN CANYON DR | 318 |
| RAMON RD | 300 |
| SUNRISE WAY | 122 |
| VISTA CHINO | 112 |
| INTERSTATE 10 | 104 |
| FARRELL DR | 78 |
| TAHQUITZ CANYON WAY | 78 |
| ARENAS RD | 72 |
| GENE AUTRY TRL | 72 |
| TRAMWAY RD | 70 |
| HIGHWAY 111 | 68 |
| SAN RAFAEL DR | 66 |
| BARISTO RD | 58 |
| TAHQUITZ CANYON WY | 56 |
| MESQUITE AVE | 52 |
| CALLE EL SEGUNDO | 48 |
| SUNNY DUNES RD | 48 |
| SUNRISE WY | 48 |
| GOLF CLUB DR | 44 |
| CALLE ENCILIA | 42 |
| CROSSLEY RD | 42 |
| AVENIDA CABALLEROS | 38 |
| GENE AUTRY | 38 |
| SUNRISE | 38 |
| CAMINO PAROCELA | 36 |
| EL CIELO RD | 34 |
| ESCOBA DR | 34 |
| INTERSTATE | 34 |
| RACQUET CLUB DR | 34 |
2005 - 2018 National Fire Incident Reporting System (NFIRS) incidents
- Incident types reported to NFIRS in Palm Springs, CA
- 18,71464.7%Rescue & EMS
- 2,8339.8%Good Intent Call
- 2,6579.2%Fire
- 2,0066.9%Hazardous Condition
- 1,6195.6%Service Call
- 1,0123.5%False Alarm
- 380.1%Special Incident
- Fire incident types reported to NFIRS in Palm Springs, CA
- 1,31749.6%Outside Fires
- 64924.4%Structure Fires
- 50919.2%Mobile Property/Vehicle Fires
- 1826.8%Other
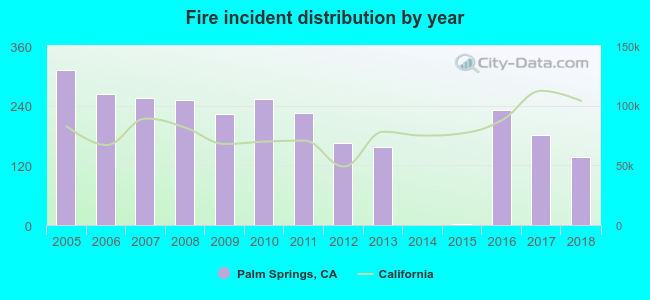 According to the data from the years 2005 - 2018 the average number of fires per year is 190. The highest number of fire incidents - 311 took place in 2005, and the least - 0 in 2014. The data has a decreasing trend.
The average number of yearly fire incidents per 10k residents in Palm Springs, CA compared to nearest cities:
(Note: Based on data for the last 3 years, including only cities with population 5,000 and above)
| Palm Springs: | 39.0 |
| Cathedral City: | 30.9 |
| Rancho Mirage: | 1.1 |
| Desert Hot Springs: | 1.2 |
| Palm Desert: | 0.6 |
| Indian Wells: | 1.9 |
| Bermuda Dunes: | 1.4 |
| La Quinta: | 0.8 |
| Idyllwild: | 13.0 |
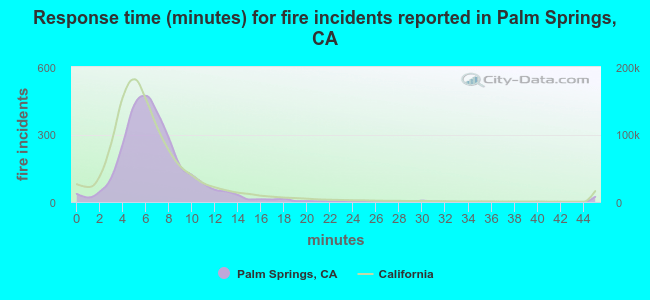 The median response time based on all reported fire incidents is 6 minutes. This is comparable to the state median value.
The median response time in Palm Springs, CA compared to nearest cities:
(Note: Based on data for all years, including only cities with at least 500 fire incidents)
| Palm Springs: | 6 minutes |
| Cathedral City: | 7 minutes |
| Hemet: | 6 minutes |
| Redlands: | 6 minutes |
| Loma Linda: | 6 minutes |
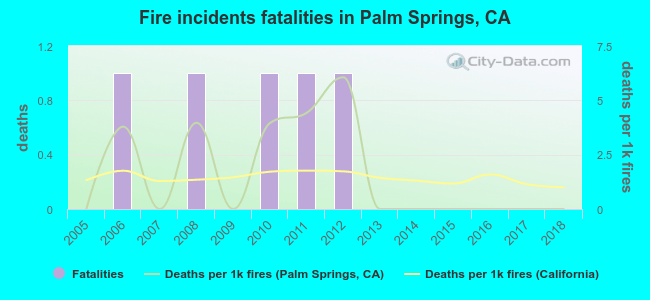 Based on the reports from the years 2005 - 2018 the average number of fire-related fatalities per year is 0. The highest number of reported deaths - 1 took place in 2006, and the lowest - 0 in 2005. The data has a constant trend.
The average number of deaths per 1,000 fires is 2. This indicator was the highest - 6 in 2012, and the lowest 0 in 2005. The trend for fatalities per 1,000 incidents is constant. Compared to the state value the number of deaths per 1,000 fire incidents is higher.
Based on the reports from the years 2005 - 2018 the average number of fire-related fatalities per year is 0. The highest number of reported deaths - 1 took place in 2006, and the lowest - 0 in 2005. The data has a constant trend.
The average number of deaths per 1,000 fires is 2. This indicator was the highest - 6 in 2012, and the lowest 0 in 2005. The trend for fatalities per 1,000 incidents is constant. Compared to the state value the number of deaths per 1,000 fire incidents is higher.Deaths per 1,000 incidents in Palm Springs, CA compared to nearest cities:
(Note: Based on data for all years, including only cities with at least 2,500 fire incidents)
| Palm Springs: | 1.9 |
| Redlands: | 0.6 |
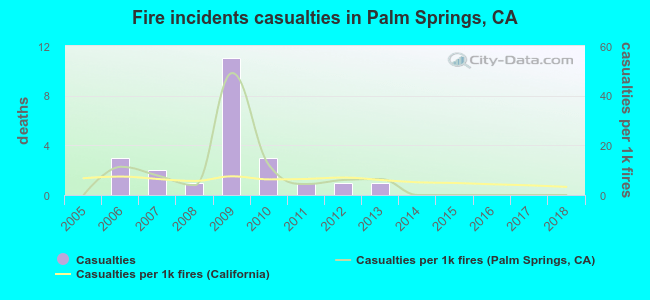 Based on the data from the years 2005 - 2018 the average number of fire-related yearly casualties is 2. The highest number of reported injuries - 11 took place in 2009, and the lowest - 0 in 2005. The data has a constant trend.
The average number of casualties per 1,000 fire incidents is 7. This indicator was the highest - 49 in 2009, and the lowest 0 in 2005. The trend for injuries per 1,000 incidents is constant. Compared to the California value the number of casualties per 1,000 incidents is higher.
Based on the data from the years 2005 - 2018 the average number of fire-related yearly casualties is 2. The highest number of reported injuries - 11 took place in 2009, and the lowest - 0 in 2005. The data has a constant trend.
The average number of casualties per 1,000 fire incidents is 7. This indicator was the highest - 49 in 2009, and the lowest 0 in 2005. The trend for injuries per 1,000 incidents is constant. Compared to the California value the number of casualties per 1,000 incidents is higher.Casualties per 1,000 incidents in Palm Springs, CA compared to nearest cities:
(Note: Based on data for all years, including only cities with at least 500 fire incidents)
| Palm Springs: | 8.7 |
| Cathedral City: | 12.2 |
| Hemet: | 11.0 |
| Redlands: | 5.5 |
| Loma Linda: | 5.9 |
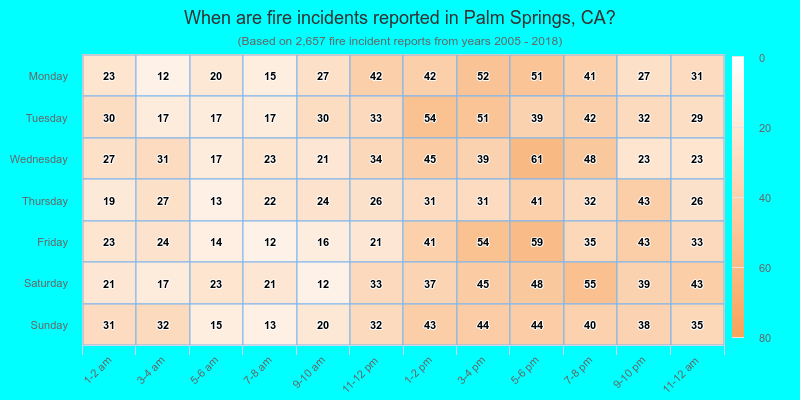
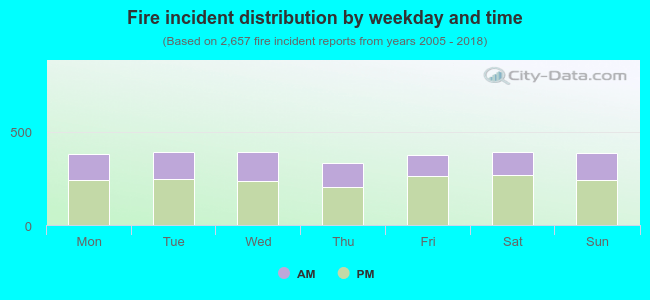 35.6% incidents where reported in the morning and 64.4% in the evening. The most fires (14.8%) took place on Saturday, and the least (12.6%) on Thursday.
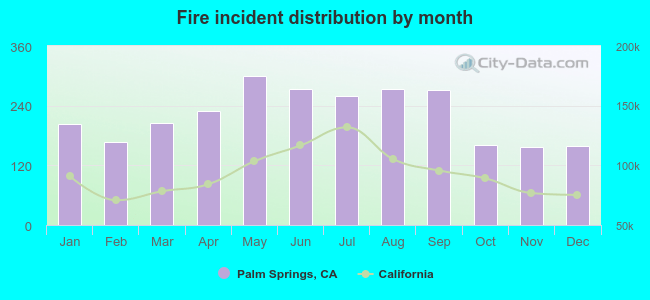 Based on the 2,657 reports from years 2005 - 2018 most fires (11.3%) took place during May, and the least (5.9%) in November.
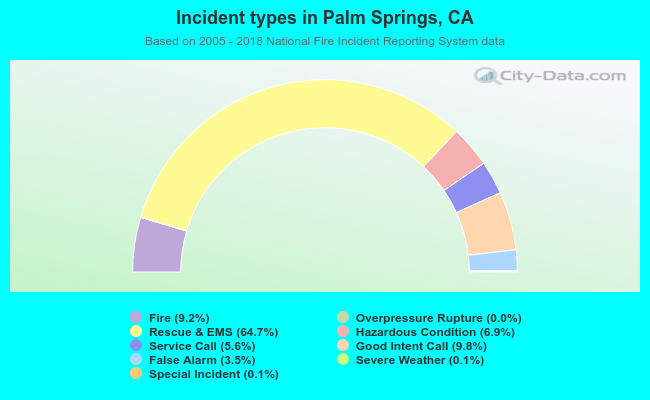 Out of all 28,908 cases reported during the years 2005 - 2018, the most belonged to the categories: Rescue & EMS (64.7%), Good Intent Call (9.8%), and Fire (9.2%).
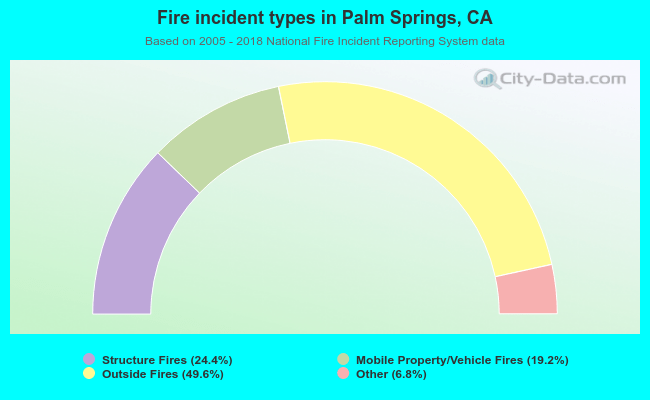 When looking into fire subcategories, the most reports belonged to: Outside Fires (49.6%), and Structure Fires (24.4%).