Panama City: Fire Incidents, Florida (FL)
Where are fire incidents reported in Panama City, FL
Something went wrong! Please refresh the page.
| Fire incidents reported | |
|---|---|
| Sreet name | Count |
| 23RD ST | 300 |
| 15TH ST | 240 |
| HARRISON AVE | 146 |
| FRANKFORD AVE | 130 |
| 11TH ST | 116 |
| 19TH ST | 108 |
| HAMILTON AVE | 104 |
| 17TH ST | 94 |
| JENKS AVE | 90 |
| THOMAS DR | 86 |
| HWY. 98 | 84 |
| BEACH DR | 80 |
| BONITA AVE | 80 |
| 6TH ST | 76 |
| EAST AVE | 76 |
| 10TH ST | 74 |
| HWY. 231 | 72 |
| 13TH ST | 68 |
| HWY 98 | 68 |
| 5TH ST | 62 |
| FRONT BEACH RD | 62 |
| 231 HWY | 58 |
| 9TH ST | 56 |
| EVERITT AVE | 56 |
| 14TH ST | 54 |
| BECK AVE | 48 |
| BALBOA AVE | 46 |
| HWY 231 | 46 |
| 8TH ST | 44 |
| BUS. HWY. 98 | 44 |
| Other | 1,273 |
2005 - 2018 National Fire Incident Reporting System (NFIRS) incidents
- Incident types reported to NFIRS in Panama City, FL
- 11,98343.8%Rescue & EMS
- 3,94114.4%Fire
- 3,71713.6%Hazardous Condition
- 3,38212.4%Service Call
- 2,2468.2%Good Intent Call
- 2,0297.4%False Alarm
- 470.2%Special Incident
- Fire incident types reported to NFIRS in Panama City, FL
- 1,66042.1%Outside Fires
- 1,46937.3%Structure Fires
- 65916.7%Mobile Property/Vehicle Fires
- 1533.9%Other
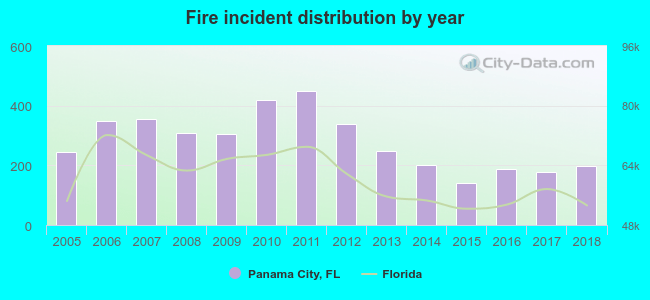 According to the data from the years 2005 - 2018 the average number of fire incidents per year is 280. The highest number of fire incidents - 449 took place in 2011, and the least - 140 in 2015. The data has a decreasing trend.
The average number of yearly fire incidents per 10k residents in Panama City, FL compared to nearest cities:
(Note: Based on data for the last 3 years, including only cities with population 5,000 and above)
| Panama City: | 49.7 |
| Springfield: | 32.8 |
| Lynn Haven: | 21.9 |
| Callaway: | 50.9 |
| Panama City Beaches: | 1.0 |
| Panama City Beach: | 135.7 |
| Southport: | 32.9 |
| Youngstown: | 35.9 |
| Miramar Beach: | 52.1 |
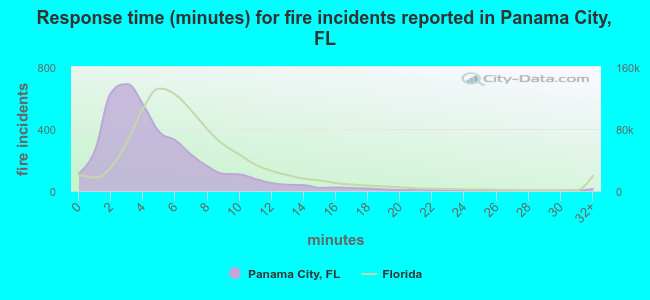 The median response time based on all reported fire incidents is 4 minutes. This is lower than the Florida median value.
The median response time in Panama City, FL compared to nearest cities:
(Note: Based on data for all years, including only cities with at least 500 fire incidents)
| Panama City: | 4 minutes |
| Springfield: | 4 minutes |
| Lynn Haven: | 3 minutes |
| Callaway: | 5 minutes |
| Panama City Beach: | 4 minutes |
| Freeport: | 8 minutes |
| Blountstown: | 4 minutes |
| Chipley: | 10 minutes |
| Westville: | 10 minutes |
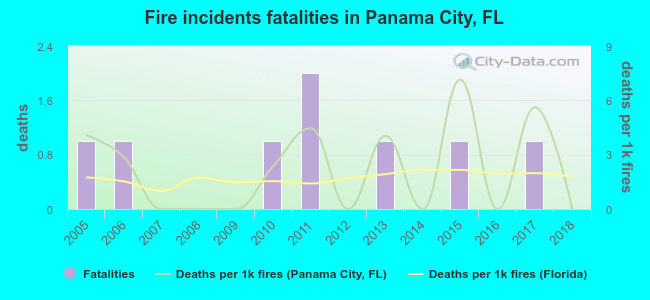 According to the reports from the years 2005 - 2018 the average number of fire-related yearly deaths is 1. The highest number of deaths - 2 took place in 2011, and the lowest - 0 in 2007. The data has a dropping trend.
The average number of deaths per 1,000 fires is 2. This indicator was the highest - 7 in 2015, and the lowest 0 in 2007. The trend for deaths per 1,000 fire incidents is decreasing. Compared to the state value the number of fatalities per 1,000 fire incidents is about the same.
According to the reports from the years 2005 - 2018 the average number of fire-related yearly deaths is 1. The highest number of deaths - 2 took place in 2011, and the lowest - 0 in 2007. The data has a dropping trend.
The average number of deaths per 1,000 fires is 2. This indicator was the highest - 7 in 2015, and the lowest 0 in 2007. The trend for deaths per 1,000 fire incidents is decreasing. Compared to the state value the number of fatalities per 1,000 fire incidents is about the same.Deaths per 1,000 incidents in Panama City, FL compared to nearest cities:
(Note: Based on data for all years, including only cities with at least 2,500 fire incidents)
| Panama City: | 2.0 |
| Panama City Beach: | 1.7 |
| Crestview: | 1.3 |
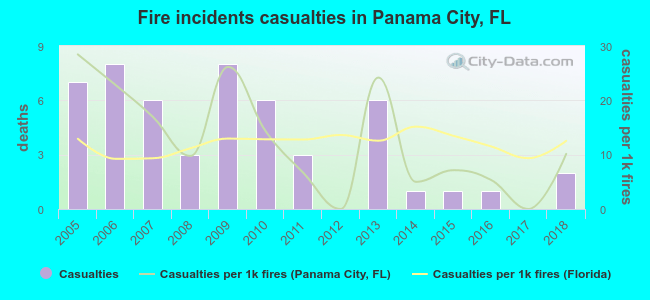 According to the reports from the years 2005 - 2018 the average number of fire-related casualties per year is 4. The highest number of reported casualties - 8 took place in 2006, and the lowest - 0 in 2012. The data has a decreasing trend.
The average number of casualties per 1,000 fire incidents is 13. This indicator was the highest - 28 in 2005, and the lowest 0 in 2012. The trend for injuries per 1,000 incidents is decreasing. Compared to the state value the number of injuries per 1,000 incidents is about the same.
According to the reports from the years 2005 - 2018 the average number of fire-related casualties per year is 4. The highest number of reported casualties - 8 took place in 2006, and the lowest - 0 in 2012. The data has a decreasing trend.
The average number of casualties per 1,000 fire incidents is 13. This indicator was the highest - 28 in 2005, and the lowest 0 in 2012. The trend for injuries per 1,000 incidents is decreasing. Compared to the state value the number of injuries per 1,000 incidents is about the same.Casualties per 1,000 incidents in Panama City, FL compared to nearest cities:
(Note: Based on data for all years, including only cities with at least 500 fire incidents)
| Panama City: | 13.2 |
| Springfield: | 6.2 |
| Lynn Haven: | 9.5 |
| Callaway: | 1.8 |
| Panama City Beach: | 3.4 |
| Freeport: | 3.1 |
| Blountstown: | 1.4 |
| Chipley: | 0.0 |
| Westville: | 1.7 |
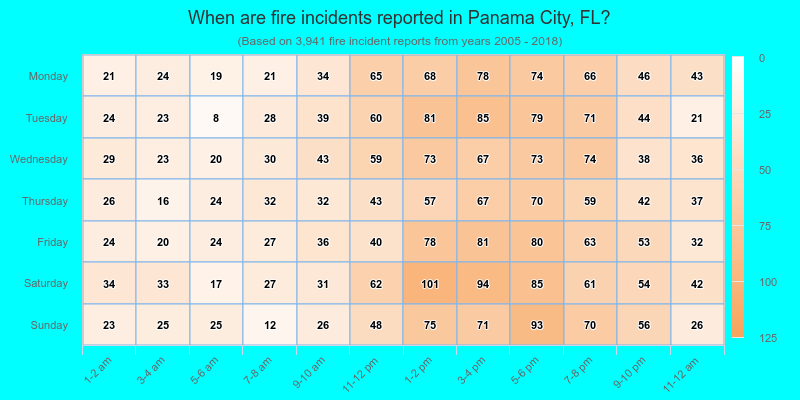
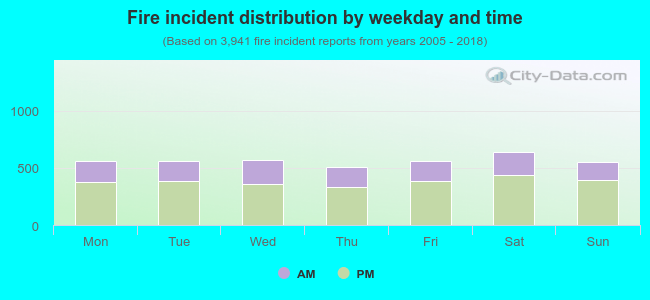 32.4% incidents where reported in the morning and 67.6% in the evening. The most fires (16.3%) took place on Saturday, and the least (12.8%) on Thursday.
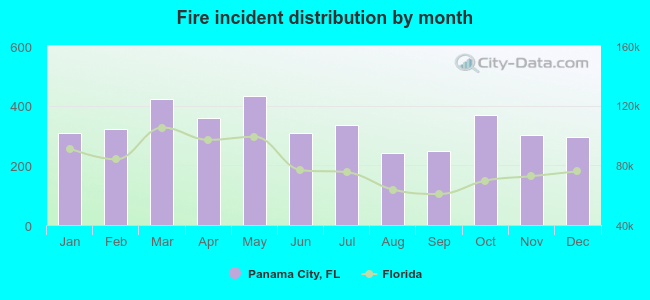 According to the 3,941 fire incidents from years 2005 - 2018 most fires (11.0%) took place during May, and the least (6.1%) in August.
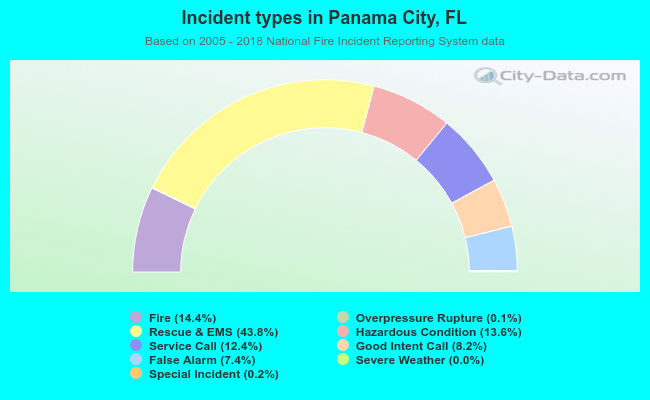 Out of all 27,384 cases reported during the years 2005 - 2018, the most belonged to the categories: Rescue & EMS (43.8%), Fire (14.4%), and Hazardous Condition (13.6%).
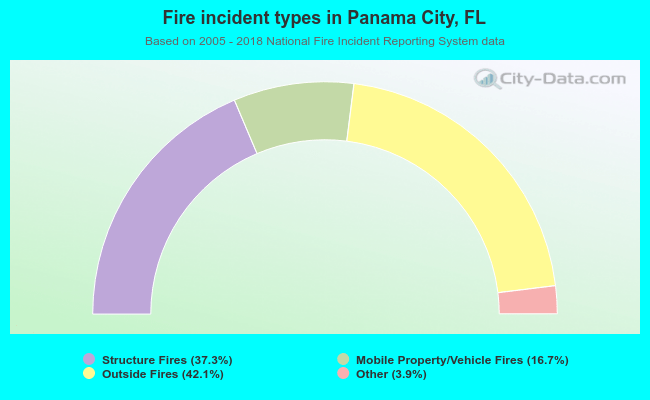 When looking into fire subcategories, the most incidents belonged to: Outside Fires (42.1%), and Structure Fires (37.3%).