| Fire incidents reported |
|---|
| Sreet name | Count |
|---|
| MARKET ST | 8 | | W PELLS | 6 | | 1000 EAST RD | 4 | | 1950 E 170 N | 4 | | INTERSTATE 57 | 4 | | MARKET ST. | 4 | | PELLS ST. | 4 | | 032 COUNTY RD 2280 FORD COUNY | 2 | | 10 LANE DRIVE | 2 | | 100 BLOCK N. MARKET ST. | 2 | | 100 BLOCK NORTH MARKET ST | 2 | | 100 E. HUNT | 2 | | 1001 E PELLS ST | 2 | | 1001 E. PARK TERRACE | 2 | | 1001 E. PELLS ST. | 2 | | 1009 PARK DRIVE | 2 | | 1043 E PROSPECT | 2 | | 105 E. STATE APPT. # 1 | 2 | | 108 W STATE ST | 2 | | 108 W STATE ST | 2 | | 110 N PLUM | 2 | | 1100 EAST RD | 2 | | 115 N MAPLE ST | 2 | | 1150 E 700 N | 2 | | 1176 ROSELAWN | 2 |
| | | Fire incidents reported |
|---|
| Sreet name | Count |
|---|
| 119 W PATTON ST | 2 | | 1190 W. OTTAWA ST. | 2 | | 12 PARKLAWN | 2 | | 120 W PINE ST | 2 | | 1240 N. MARKET ST. | 2 | | 1300 EAST | 2 | | 132 N MARKET ST | 2 | | 133 SO. MARKET ST. | 2 | | 1350 EAST RD | 2 | | 140 S MARKET ST | 2 | | 140 S MARKET ST. | 2 | | 140 W. CENTER ST. | 2 | | 1450 EAST RD | 2 | | 1450E 574N FORD CO | 2 | | 15 N 1400 E | 2 | | 15 N 1400 E | 2 | | 150 N 2400 E | 2 | | 150 N 2000 E | 2 | | 150 N 2000 E | 2 | | 150N 2250E | 2 | | 1600 E 348 N | 2 | | 1600 E 250 N | 2 | | 1600 E. 500N RD | 2 | | 1640 E. RT 9 | 2 | | 1646 E 3500 N | 2 |
|
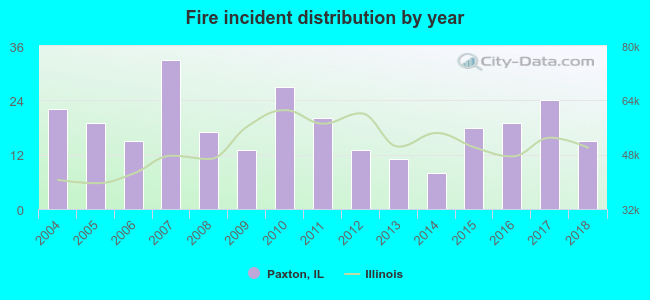 Based on the data from the years 2004 - 2018 the average number of fires per year is 18. The highest number of fire incidents - 33 took place in 2007, and the least - 8 in 2014. The data has a decreasing trend.
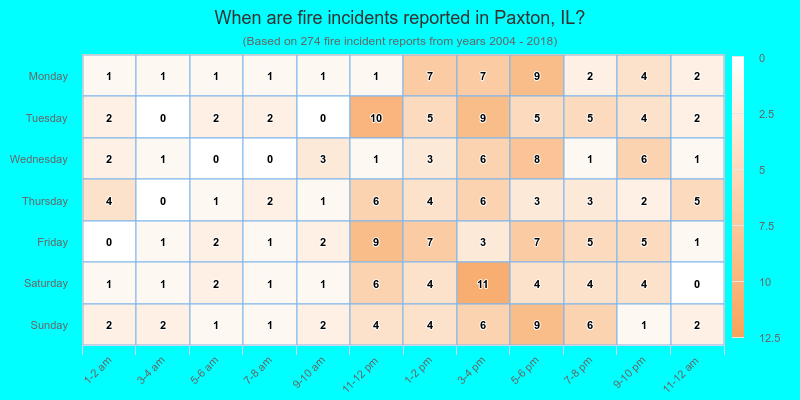
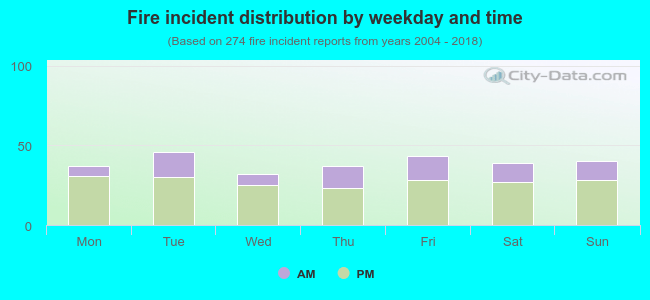 29.9% incidents where reported in the morning and 70.1% in the evening. The most fires (16.8%) took place on Tuesday, and the least (11.7%) on Wednesday.
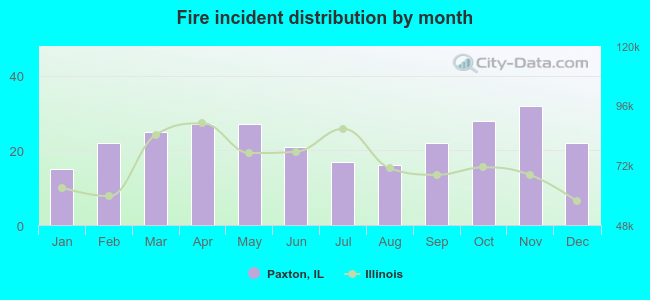 According to the 274 reports from years 2004 - 2018 most fires (11.7%) took place during November, and the least (5.5%) in January.
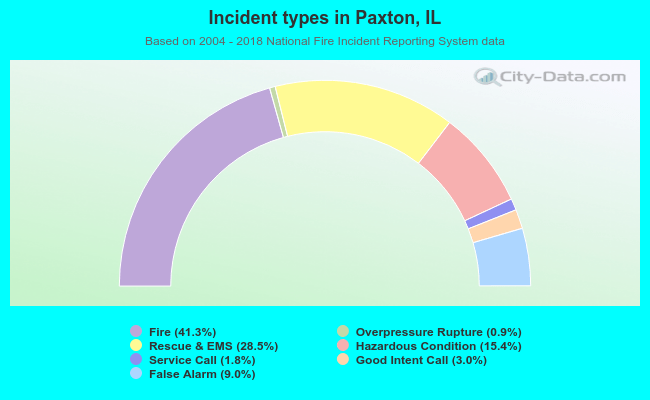 Out of all 663 cases reported during the years 2004 - 2018, the most belonged to the categories: Fire (41.3%), Rescue & EMS (28.5%), and Hazardous Condition (15.4%).
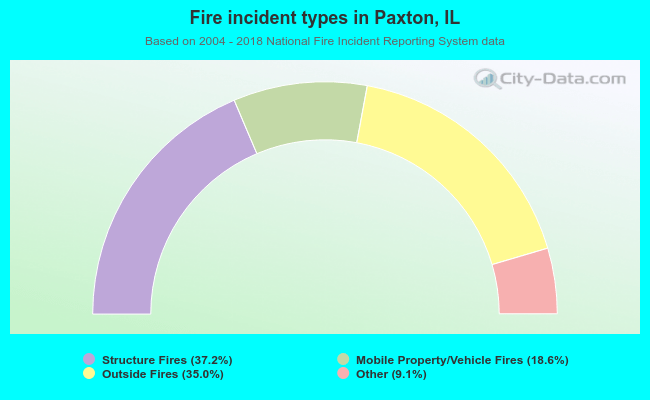 When looking into fire subcategories, the most reports belonged to: Structure Fires (37.2%), and Outside Fires (35.0%).