Pella: Fire Incidents, Iowa (IA)
Where are fire incidents reported in Pella, IA
Something went wrong! Please refresh the page.
|
| |||||||||||||||||||||||||||||||||||||||||||||||||||||||||||||||||||||||||||||||||||||||||||||||||||||||||||||
2002 - 2018 National Fire Incident Reporting System (NFIRS) incidents
- Incident types reported to NFIRS in Pella, IA
- 51940.0%Fire
- 25419.6%Hazardous Condition
- 23718.3%Good Intent Call
- 1299.9%Rescue & EMS
- 987.6%False Alarm
- 544.2%Service Call
- 30.2%Overpressure Rupture
- 30.2%Severe Weather
- Fire incident types reported to NFIRS in Pella, IA
- 24346.8%Outside Fires
- 14828.5%Structure Fires
- 7714.8%Mobile Property/Vehicle Fires
- 519.8%Other
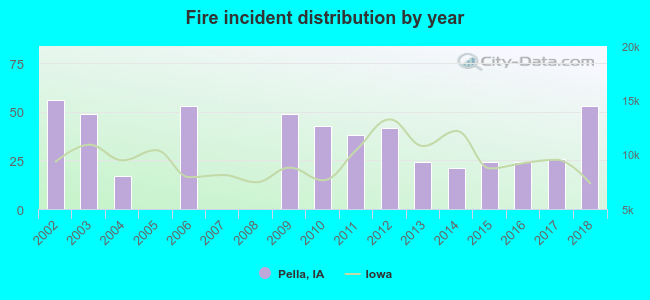 According to the data from the years 2002 - 2018 the average number of fires per year is 31. The highest number of reported fire incidents - 56 took place in 2002, and the least - 0 in 2005. The data has a decreasing trend.
The average number of yearly fire incidents per 10k residents in Pella, IA compared to nearest cities:
(Note: Based on data for the last 3 years, including only cities with population 5,000 and above)
| Pella: | 33.2 |
| Knoxville: | 24.8 |
| Oskaloosa: | 40.1 |
| Newton: | 20.7 |
| Grinnell: | 52.2 |
| Pleasant Hill: | 13.1 |
| Altoona: | 12.6 |
| Indianola: | 7.6 |
| Ottumwa: | 101.5 |
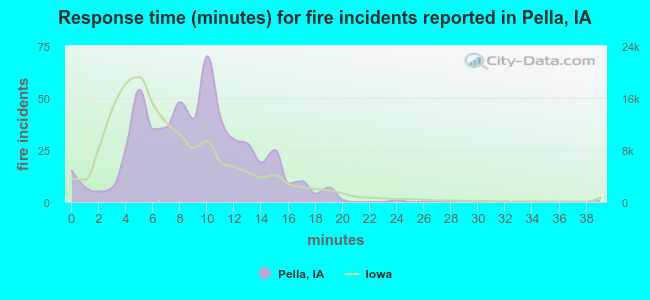 The median response time based on all reported fire incidents is 9 minutes. This is higher than the Iowa median value.
The median response time in Pella, IA compared to nearest cities:
(Note: Based on data for all years, including only cities with at least 500 fire incidents)
| Pella: | 9 minutes |
| Oskaloosa: | 5 minutes |
| Newton: | 7 minutes |
| Grinnell: | 5 minutes |
| Pleasant Hill: | 10 minutes |
| Altoona: | 7 minutes |
| Indianola: | 8 minutes |
| Chariton: | 6 minutes |
| Ottumwa: | 4 minutes |
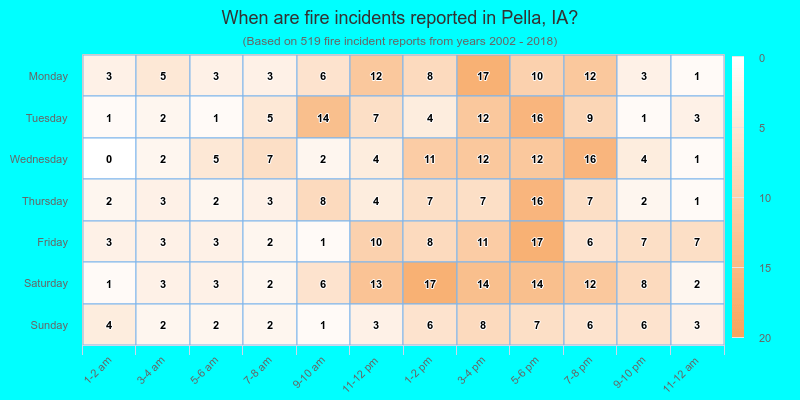
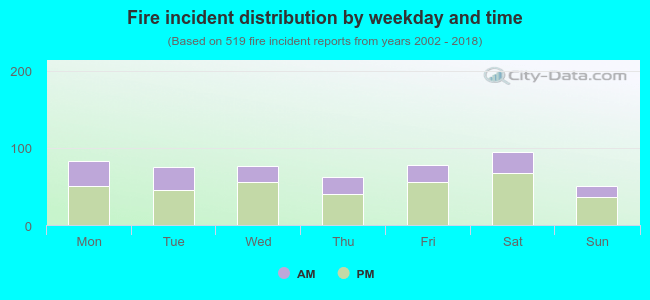 32.4% incidents where reported in the morning and 67.6% in the evening. The most fires (18.3%) took place on Saturday, and the least (9.6%) on Sunday.
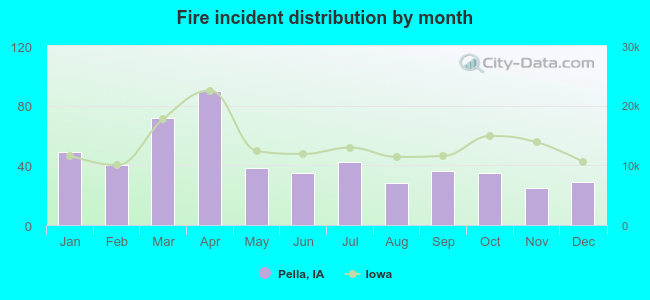 According to the 519 reports from years 2002 - 2018 most fires (17.3%) took place during April, and the least (4.8%) in November.
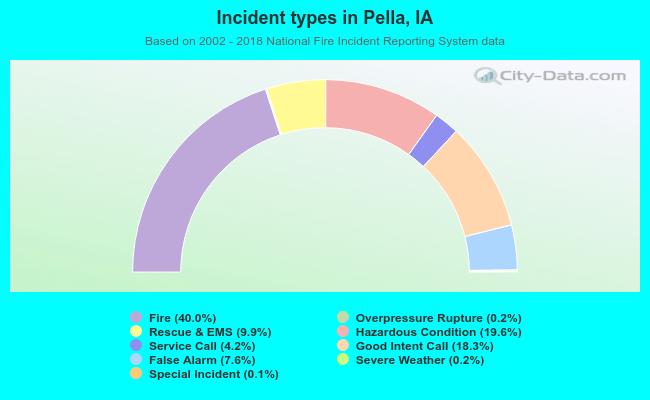 Out of all 1,298 cases reported during the years 2002 - 2018, the most belonged to the categories: Fire (40.0%), Hazardous Condition (19.6%), and Good Intent Call (18.3%).
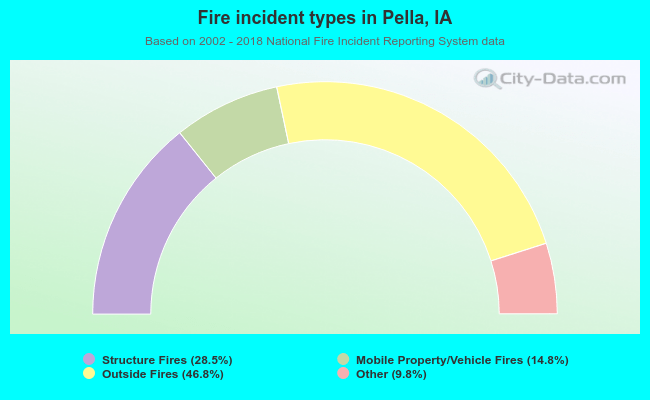 When looking into fire subcategories, the most incidents belonged to: Outside Fires (46.8%), and Structure Fires (28.5%).