Perry: Fire Incidents, Ohio (OH)
Where are fire incidents reported in Perry, OH
Something went wrong! Please refresh the page.
|
| |||||||||||||||||||||||||||||||||||||||||||||||||||||||||||||||||||||||||||||||||||||||||||||||||||||||||||||
2002 - 2018 National Fire Incident Reporting System (NFIRS) incidents
- Incident types reported to NFIRS in Perry, OH
- 2,67946.1%Rescue & EMS
- 97716.8%Hazardous Condition
- 95916.5%Service Call
- 59510.2%Fire
- 2905.0%False Alarm
- 2864.9%Good Intent Call
- 80.1%Severe Weather
- 70.1%Special Incident
- Fire incident types reported to NFIRS in Perry, OH
- 32955.3%Structure Fires
- 20133.8%Outside Fires
- 6010.1%Mobile Property/Vehicle Fires
- 50.8%Other
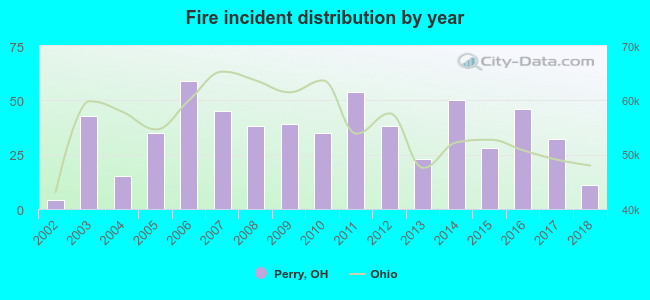 Based on the data from the years 2002 - 2018 the average number of fires per year is 35. The highest number of reported fires - 59 took place in 2006, and the least - 4 in 2002. The data has a rising trend.
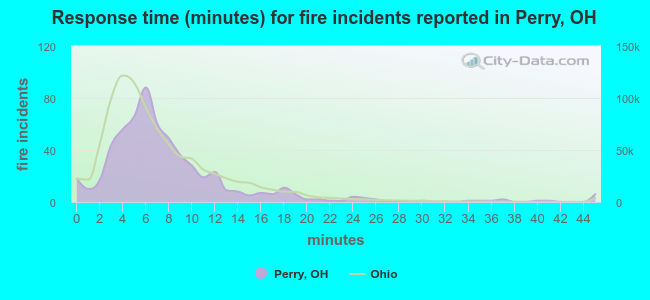 The median response time based on all reported fire incidents is 6 minutes. This is about the same as the Ohio median value.
The median response time in Perry, OH compared to nearest cities:
(Note: Based on data for all years, including only cities with at least 500 fire incidents)
| Perry: | 6 minutes |
| Madison: | 7 minutes |
| Painesville: | 5 minutes |
| Geneva: | 7 minutes |
| Mentor: | 6 minutes |
| Chardon: | 7 minutes |
| Kirtland: | 6 minutes |
| Willoughby: | 4 minutes |
| Eastlake: | 5 minutes |
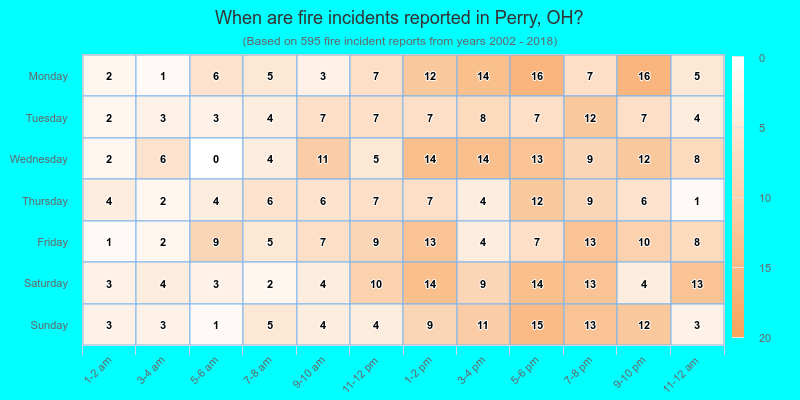
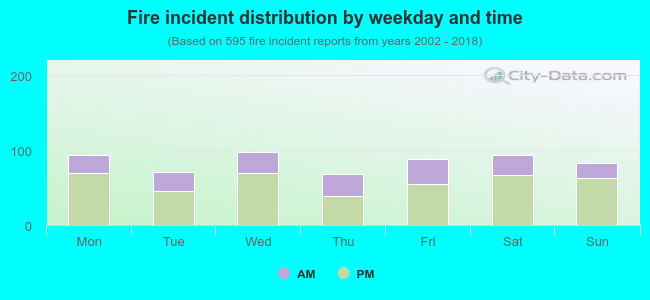 31.3% incidents where reported in the morning and 68.7% in the evening. The most fires (16.5%) took place on Wednesday, and the least (11.4%) on Thursday.
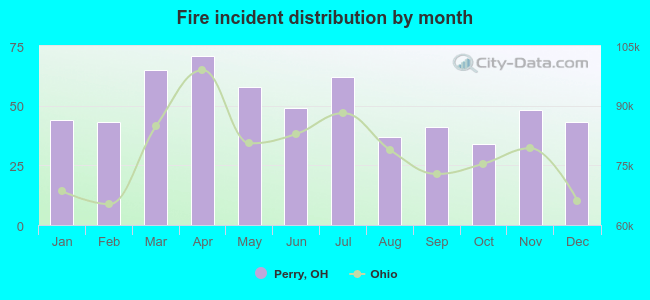 Based on the 595 reports from years 2002 - 2018 most fires (11.9%) took place during April, and the least (5.7%) in October.
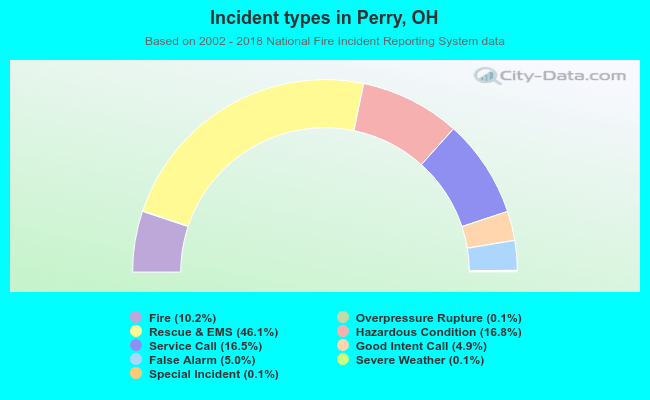 Out of all 5,805 cases reported during the years 2002 - 2018, the most belonged to the categories: Rescue & EMS (46.1%), Hazardous Condition (16.8%), and Service Call (16.5%).
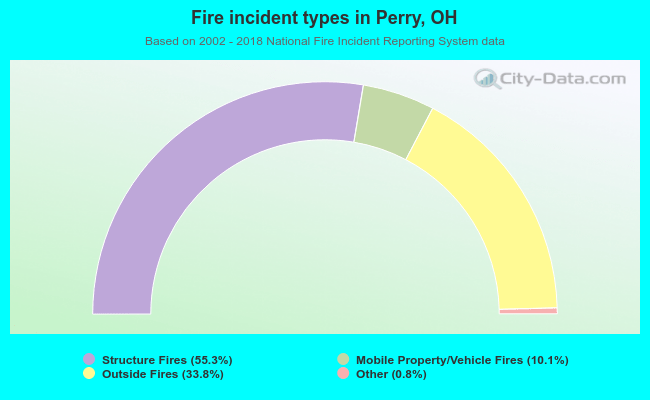 When looking into fire subcategories, the most incidents belonged to: Structure Fires (55.3%), and Outside Fires (33.8%).