| Fire incidents reported |
|---|
| Sreet name | Count |
|---|
| ADAIR ROAD | 20 | | BOZOO ROAD | 20 | | RT 219 | 20 | | RT 12 | 18 | | DOC YOUNG ROAD | 12 | | BRUSH CREEK ROAD | 8 | | MILL STREET | 8 | | MINNIE DUNN ROAD | 8 | | CHICKENPIN LANE | 6 | | CLYDE RULE STREET | 6 | | LOWER MILL STREET | 6 | | RICH CREEK VALLEY ROAD | 6 | | RT. 1 BOX 207 | 6 | | RT. 12 | 6 | | RT. 219 | 6 | | STANLEY HILL | 6 | | 1199 LITTLE RICH CREEK VALLEY | 4 | | 48 REINDEER LANE | 4 | | 653 C WOODLAND DRIVE | 4 | | 81 LOWER MILL STREET | 4 | | CHEROKEE STRIP | 4 | | CROSSVIEW ESTATES ROAD | 4 | | GREEN VALLEY ROAD | 4 | | HANSBARGER ROAD | 4 | | INDIAN MILLS ROAD | 4 |
| | | Fire incidents reported |
|---|
| Sreet name | Count |
|---|
| LITTLE RICH CREEK VALLEY ROAD | 4 | | PETE ROSE LANE | 4 | | RT 219 4 MILES | 4 | | RT. 81 BOX 82 | 4 | | SHANKLIN FERRY ROAD | 4 | | SHANKLINS FERRY RD RD | 4 | | STINKING LICK ROAD | 4 | | WOODSON ROAD | 4 | | #9 EDGE WOOD PARK DRIVE | 2 | | 104 RACE ST | 2 | | 104 RACE STREET | 2 | | 116 HILLCREST DRIVE | 2 | | 117 LOWER MILL STREET | 2 | | 1177 LITTLE RICH CREEK VALLEY | 2 | | 12 SYCMORE ST | 2 | | 122 WALNUT STREET | 2 | | 13 EAST MARKET STREET | 2 | | 1320 BOZOO ROAD | 2 | | 1352 BOZOO ROAD | 2 | | 14 SLIVERADO DRIVE | 2 | | 1552 SENECA TRAIL SOUTH | 2 | | 1562 SENECA TRAIL SOUTH | 2 | | 1572 RICH CREEK VALLEY RD | 2 | | 1690 SENECA TRAIL SOUTH | 2 | | |
|
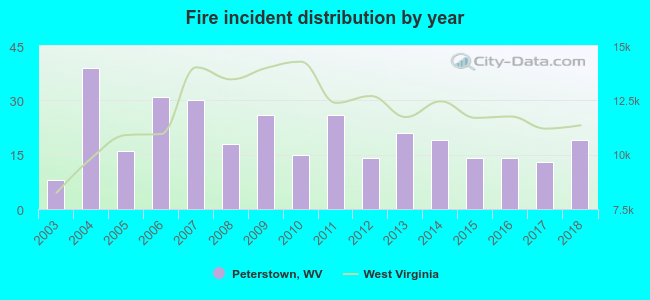 According to the data from the years 2003 - 2018 the average number of fires per year is 20. The highest number of fire incidents - 39 took place in 2004, and the least - 8 in 2003. The data has a growing trend.
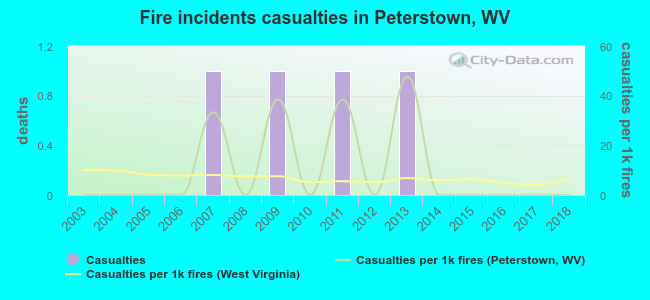 Based on the reports from the years 2003 - 2018 the average number of fire-related casualties per year is 0. The highest number of injuries - 1 took place in 2007, and the lowest - 0 in 2003. The data has a constant trend.
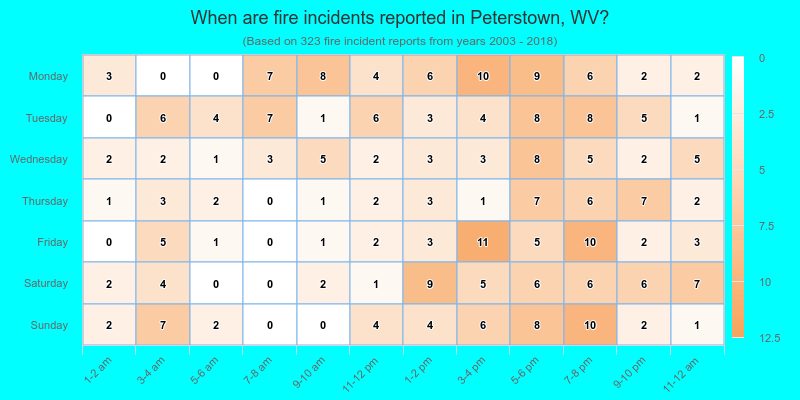
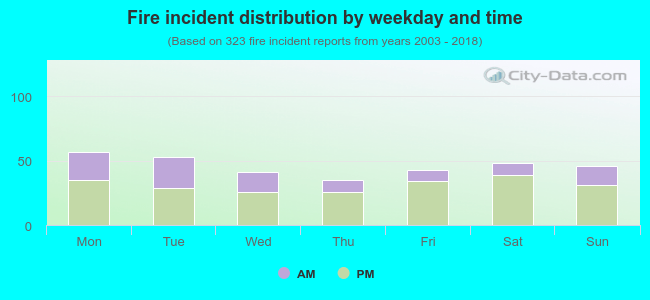 31.9% incidents where reported in the morning and 68.1% in the evening. The most fires (17.6%) took place on Monday, and the least (10.8%) on Thursday.
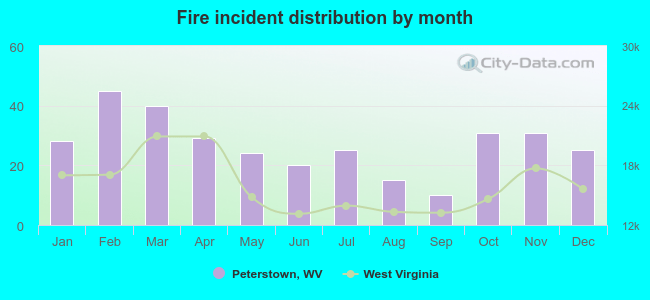 According to the 323 fires from years 2003 - 2018 most fires (13.9%) took place during February, and the least (3.1%) in September.
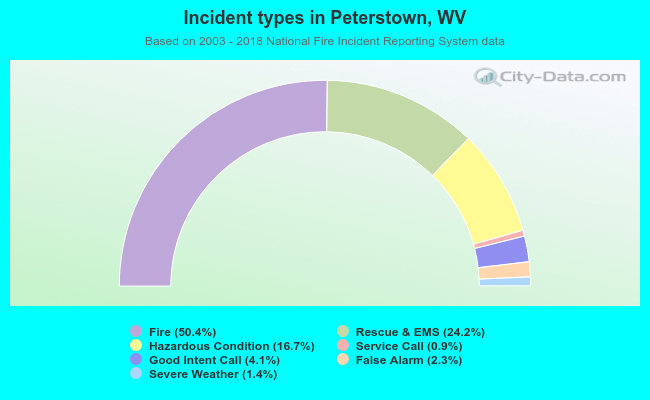 Out of all 641 cases reported during the years 2003 - 2018, the most belonged to the categories: Fire (50.4%), Overpressure Rupture (24.2%), and Rescue & EMS (16.7%).
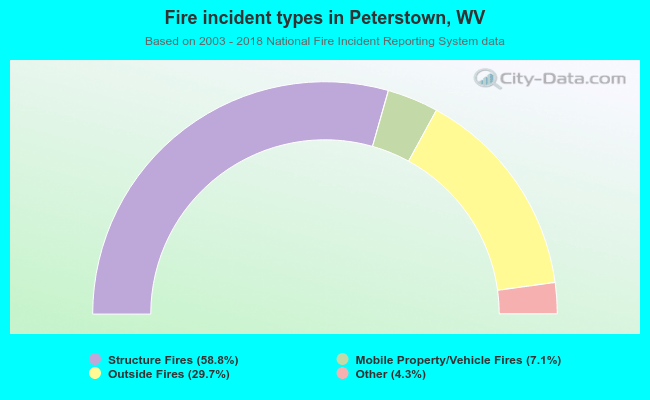 When looking into fire subcategories, the most incidents belonged to: Structure Fires (58.8%), and Outside Fires (29.7%).