Phoenix: Fire Incidents, Arizona (AZ)
Where are fire incidents reported in Phoenix, AZ
Something went wrong! Please refresh the page.
| Fire incidents reported | |
|---|---|
| Sreet name | Count |
| 35TH AV | 2,676 |
| 19TH AV | 2,654 |
| 7TH ST | 2,564 |
| INDIAN SCHOOL RD | 2,270 |
| I17 | 1,944 |
| MCDOWELL RD | 1,870 |
| 16TH ST | 1,788 |
| THOMAS RD | 1,700 |
| 27TH AV | 1,692 |
| 32ND ST | 1,582 |
| I10 | 1,582 |
| BELL RD | 1,436 |
| 43RD AV | 1,330 |
| VAN BUREN ST | 1,328 |
| CAMELBACK RD | 1,302 |
| 7TH AV | 1,298 |
| CENTRAL AV | 1,290 |
| 40TH ST | 1,208 |
| 24TH ST | 1,178 |
| 12TH ST | 1,170 |
| CAVE CREEK RD | 1,122 |
| 15TH AV | 1,060 |
| 51ST AV | 1,060 |
| 19TH | 1,038 |
| BLACK CANYON AC | 1,018 |
| 35TH | 986 |
| OSBORN RD | 948 |
| 28TH ST | 892 |
| 48TH ST | 868 |
| 39TH AV | 846 |
| Other | 34,913 |
2004 - 2018 National Fire Incident Reporting System (NFIRS) incidents
- Incident types reported to NFIRS in Phoenix, AZ
- 78,61340.9%Fire
- 33,29417.3%False Alarm
- 24,99613.0%Service Call
- 22,27611.6%Hazardous Condition
- 17,5929.1%Rescue & EMS
- 12,8666.7%Good Intent Call
- 1,9581.0%Overpressure Rupture
- 8140.4%Special Incident
- Fire incident types reported to NFIRS in Phoenix, AZ
- 35,18244.8%Outside Fires
- 18,28423.3%Structure Fires
- 14,90019.0%Mobile Property/Vehicle Fires
- 10,24713.0%Other
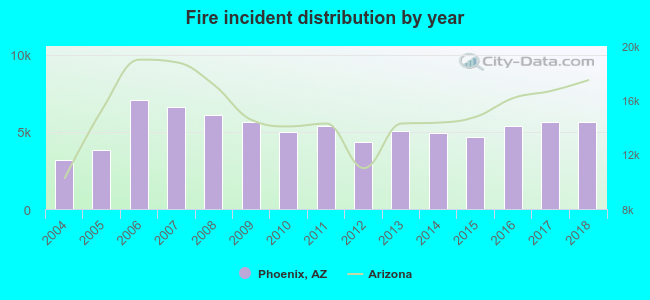 Based on the data from the years 2004 - 2018 the average number of fire incidents per year is 5,233. The highest number of fires - 7,056 took place in 2006, and the least - 3,185 in 2004. The data has a rising trend.
The average number of yearly fire incidents per 10k residents in Phoenix, AZ compared to nearest cities:
(Note: Based on data for the last 3 years, including only cities with population 5,000 and above)
| Phoenix: | 36.2 |
| Paradise Valley: | 5.9 |
| Glendale: | 0.8 |
| Scottsdale: | 14.2 |
| Tolleson: | 96.7 |
| Tempe: | 29.2 |
| Guadalupe: | 9.3 |
| Peoria: | 6.5 |
| Sun City: | 22.6 |
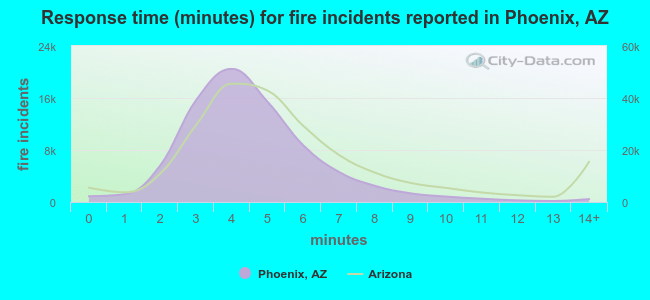 The median response time based on all reported fire incidents is 4 minutes. This is lower than the state median value.
The median response time in Phoenix, AZ compared to nearest cities:
(Note: Based on data for all years, including only cities with at least 500 fire incidents)
| Phoenix: | 4 minutes |
| Glendale: | 4 minutes |
| Scottsdale: | 5 minutes |
| Tempe: | 4 minutes |
| Peoria: | 5 minutes |
| Sun City: | 4 minutes |
| Avondale: | 5 minutes |
| El Mirage: | 5 minutes |
| Chandler: | 5 minutes |
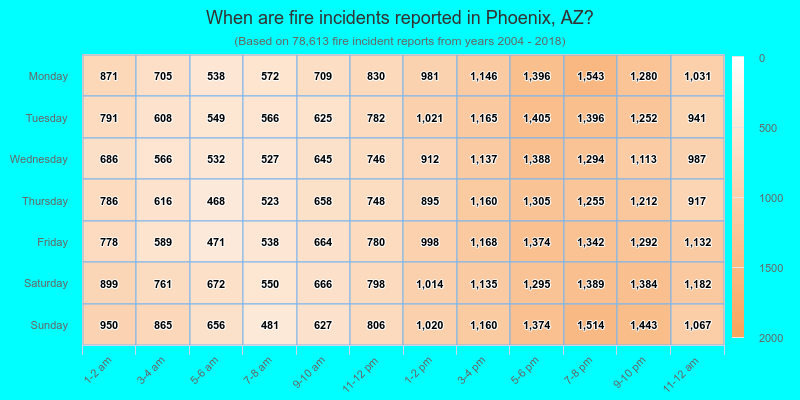
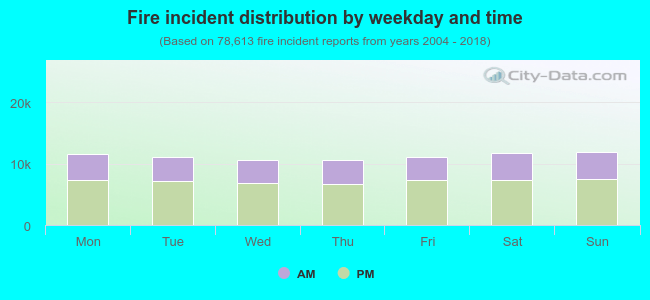 35.9% incidents where reported in the morning and 64.1% in the evening. The most fires (15.2%) took place on Sunday, and the least (13.4%) on Wednesday.
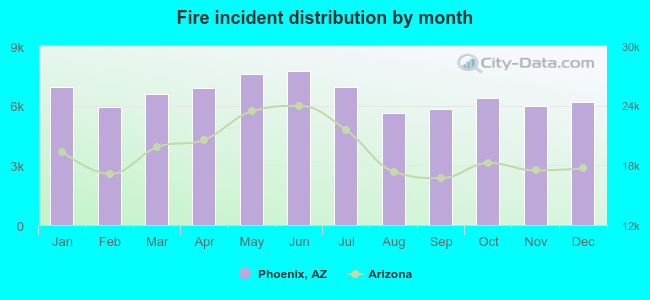 According to the 78,613 fire incidents from years 2004 - 2018 most fires (9.8%) took place during June, and the least (7.2%) in August.
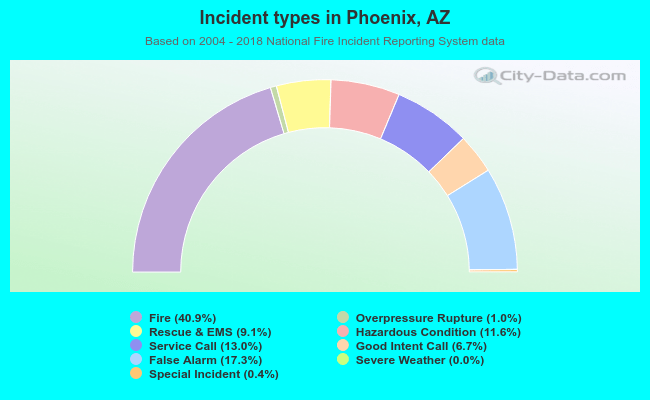 Out of all 192,415 cases reported during the years 2004 - 2018, the most belonged to the categories: Fire (40.9%), False Alarm (17.3%), and Service Call (13.0%).
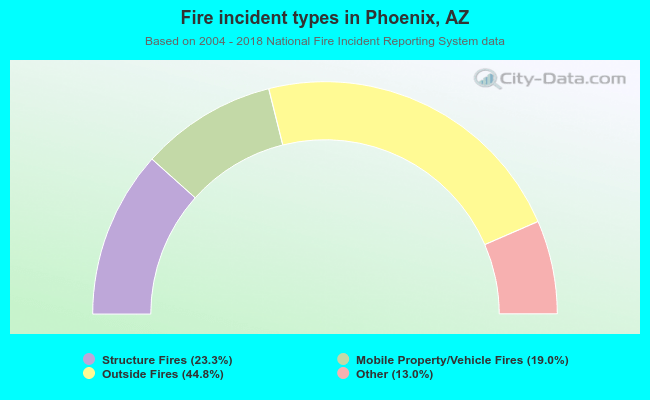 When looking into fire subcategories, the most reports belonged to: Outside Fires (44.8%), and Structure Fires (23.3%).