| Fire incidents reported |
|---|
| Sreet name | Count |
|---|
| MISSION CREEK | 24 | | POKEGAMA | 20 | | ROCK CREEK | 20 | | HIGHWAY 70 | 18 | | PINE CITY | 18 | | 560TH ST | 14 | | INTERSTATE 35 | 14 | | STATE HIGHWAY 35 HWY | 14 | | POKEGAMA LAKE RD | 10 | | ROYALTON | 10 | | 8TH ST | 8 | | CHENGWATANA | 8 | | FOREST BLVD | 8 | | HIGHWAY I -35 | 8 | | PINE TOWNSHIP | 8 | | BEROUN CROSSING RD | 6 | | CEDAR CREEK RD | 6 | | CROOKED RIVER RD | 6 | | HOMESTEAD RD | 6 | | JOHNSON AVE | 6 | | MAIN STREET SOUTH | 6 | | 1 ST AVE | 4 | | 100 HILLSIDE AVE | 4 | | 10TH ST | 4 | | 14663 CROSS LAKE RD | 4 |
| | | Fire incidents reported |
|---|
| Sreet name | Count |
|---|
| 15545 | 4 | | 18863 LIBERTY RD RD | 4 | | 2ND ST | 4 | | 350 JOHNSON AVE | 4 | | 3RD ST | 4 | | 540TH ST | 4 | | 56359 FREEDOM AVE | 4 | | 5TH AVE | 4 | | 8570 BRUNSWICK RD | 4 | | 8623 WOODLAND RD | 4 | | 8TH ST SW | 4 | | BAY SIDE LOOP | 4 | | COUNTY RD 11 | 4 | | COUNTY RD 8 | 4 | | CROOKED RIVER ROAD | 4 | | FOREST RD | 4 | | FREEDOM AVE. | 4 | | HENRIETTE RD RD | 4 | | HIGHWAY 23 | 4 | | HIGHWAY 61 | 4 | | HILLSIDE AVE | 4 | | JOHNSON AVE | 4 | | LOON DRIVE | 4 | | MAIN STREET | 4 | | |
|
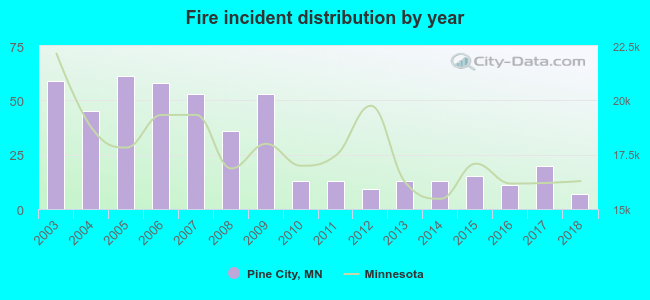 According to the data from the years 2003 - 2018 the average number of fires per year is 30. The highest number of reported fires - 61 took place in 2005, and the least - 7 in 2018. The data has a decreasing trend.
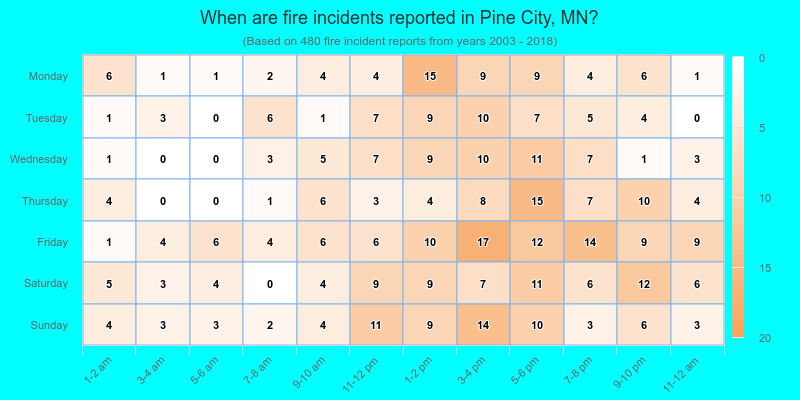
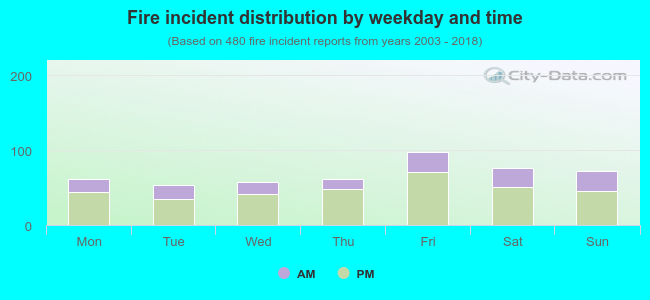 30.2% incidents where reported in the morning and 69.8% in the evening. The most fires (20.4%) took place on Friday, and the least (11.0%) on Tuesday.
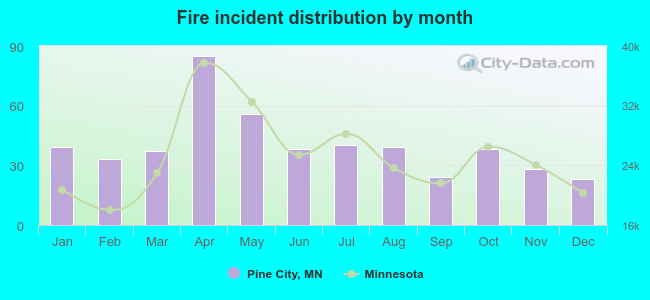 According to the 480 reports from years 2003 - 2018 most fires (17.7%) took place during April, and the least (4.8%) in December.
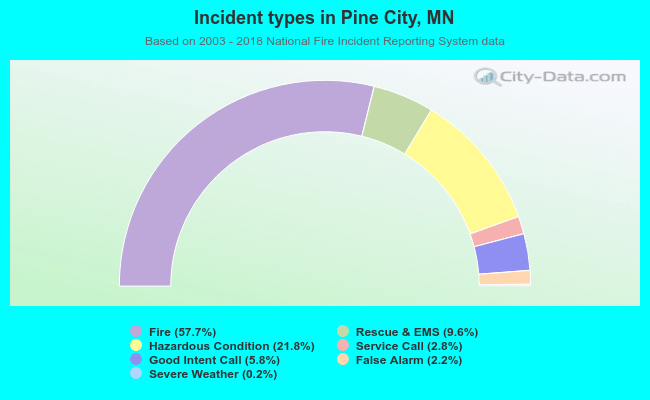 Out of all 832 cases reported during the years 2003 - 2018, the most belonged to the categories: Fire (57.7%), Rescue & EMS (21.8%), and Overpressure Rupture (9.6%).
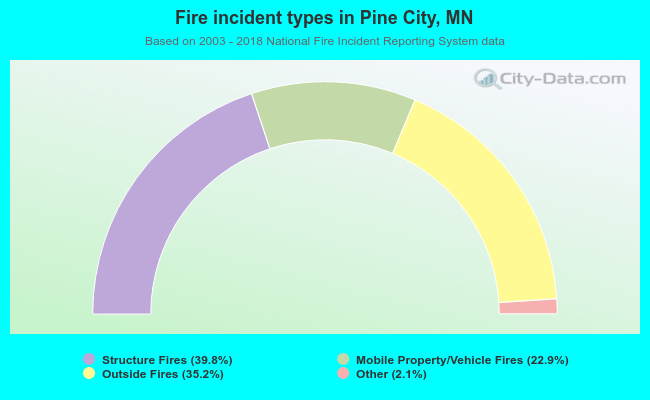 When looking into fire subcategories, the most incidents belonged to: Structure Fires (39.8%), and Outside Fires (35.2%).