Plummer: Fire Incidents, Idaho (ID)
Where are fire incidents reported in Plummer, ID
Something went wrong! Please refresh the page.
|
| |||||||||||||||||||||||||||||||||||||||||||||||||||||||||||||||||||||||||||||||||||||||||||||||||||||||||||||
2002 - 2018 National Fire Incident Reporting System (NFIRS) incidents
- Incident types reported to NFIRS in Plummer, ID
- 1,15662.5%Rescue & EMS
- 39421.3%Fire
- 1417.6%Good Intent Call
- 1136.1%Hazardous Condition
- 271.5%Service Call
- 181.0%False Alarm
- Fire incident types reported to NFIRS in Plummer, ID
- 21855.3%Outside Fires
- 12331.2%Structure Fires
- 4210.7%Mobile Property/Vehicle Fires
- 112.8%Other
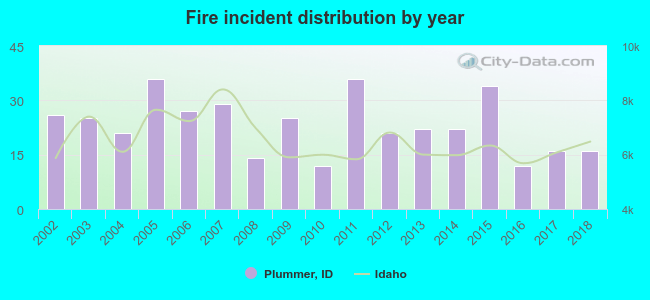 Based on the data from the years 2002 - 2018 the average number of fires per year is 23. The highest number of fire incidents - 36 took place in 2005, and the least - 12 in 2010. The data has a dropping trend.
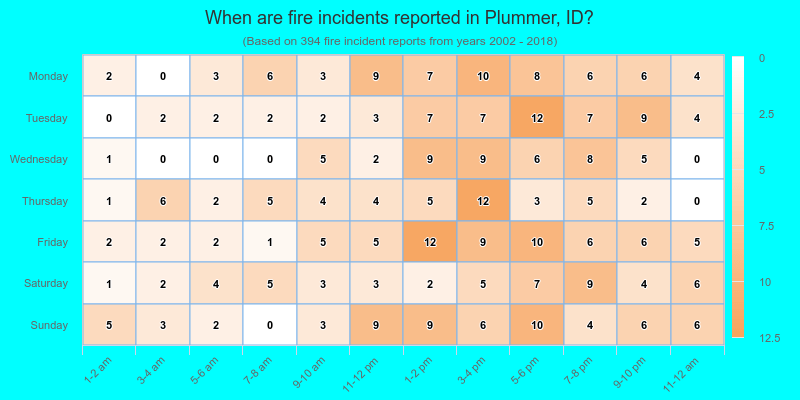
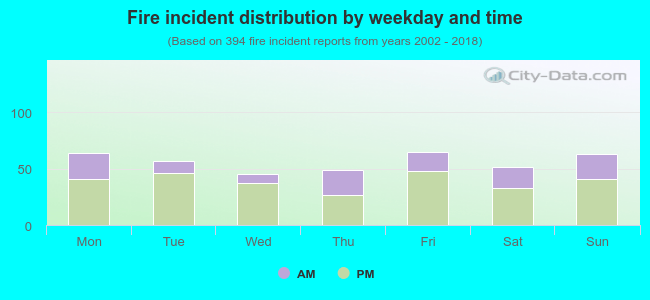 30.7% incidents where reported in the morning and 69.3% in the evening. The most fires (16.5%) took place on Friday, and the least (11.4%) on Wednesday.
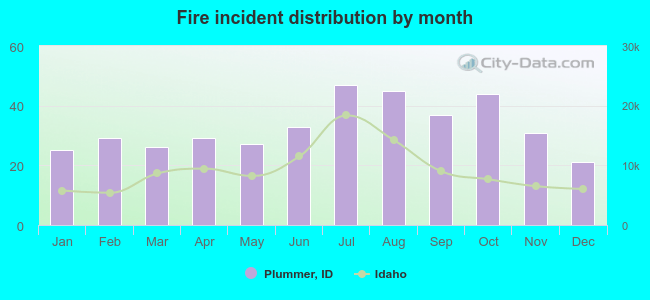 Based on the 394 incident reports from years 2002 - 2018 most fires (11.9%) took place during July, and the least (5.3%) in December.
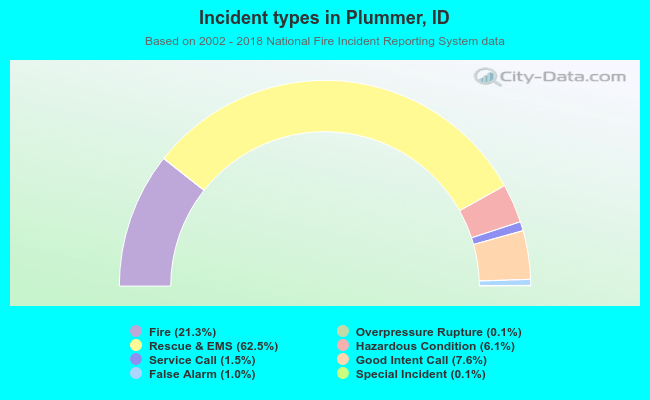 Out of all 1,851 cases reported during the years 2002 - 2018, the most belonged to the categories: Rescue & EMS (62.5%), Fire (21.3%), and Good Intent Call (7.6%).
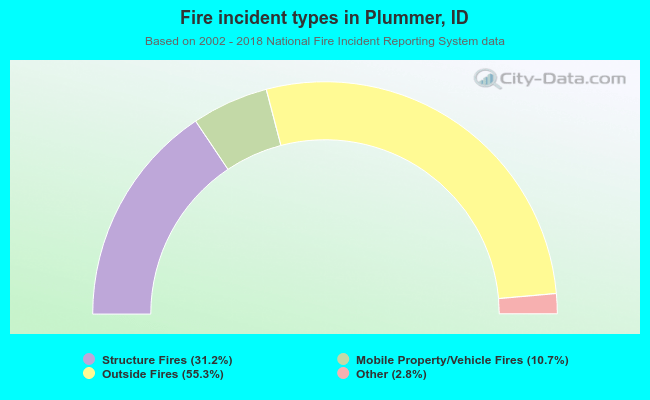 When looking into fire subcategories, the most incidents belonged to: Outside Fires (55.3%), and Structure Fires (31.2%).