Pocatello: Fire Incidents, Idaho (ID)
Where are fire incidents reported in Pocatello, ID
Something went wrong! Please refresh the page.
| Fire incidents reported | |
|---|---|
| Sreet name | Count |
| MAIN ST | 136 |
| 5TH AVE | 116 |
| CENTER ST | 100 |
| QUINN RD | 98 |
| YELLOWSTONE AVE | 84 |
| ARTHUR AVE | 56 |
| HAYES AVE | 56 |
| 4TH AVE | 52 |
| CLARK ST | 52 |
| BANNOCK HWY | 46 |
| 2ND AVE | 44 |
| MCKINLEY AVE | 44 |
| 3RD AVE | 42 |
| POLELINE RD | 42 |
| BENCH RD | 40 |
| ARTHUR AV | 38 |
| CEDAR ST | 38 |
| POCATELLO CREEK RD | 38 |
| ALAMEDA RD | 32 |
| HAWTHORNE RD | 32 |
| JEFFERSON AVE | 32 |
| WHITMAN ST | 30 |
| WILSON AVE | 30 |
| YELLOWSTONE AV | 30 |
| BARTON RD | 28 |
| POCATELLO CRK | 28 |
| GRANT AVE | 26 |
| HURLEY DR | 26 |
| BARTZ WAY | 24 |
| BUCKSKIN RD | 24 |
| Other | 791 |
2002 - 2018 National Fire Incident Reporting System (NFIRS) incidents
- Incident types reported to NFIRS in Pocatello, ID
- 21,84573.2%Rescue & EMS
- 2,2557.6%Fire
- 1,9426.5%Hazardous Condition
- 1,6575.6%Good Intent Call
- 1,3904.7%False Alarm
- 6692.2%Service Call
- 430.1%Severe Weather
- 350.1%Special Incident
- Fire incident types reported to NFIRS in Pocatello, ID
- 96442.7%Structure Fires
- 81536.1%Outside Fires
- 30713.6%Mobile Property/Vehicle Fires
- 1697.5%Other
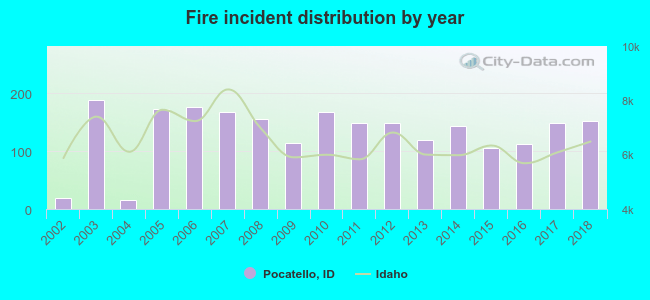 Based on the data from the years 2002 - 2018 the average number of fires per year is 133. The highest number of fire incidents - 188 took place in 2003, and the least - 15 in 2004. The data has a growing trend.
The average number of yearly fire incidents per 10k residents in Pocatello, ID compared to nearest cities:
(Note: Based on data for the last 3 years, including only cities with population 5,000 and above)
| Pocatello: | 25.5 |
| Chubbuck: | 18.5 |
| Moreland: | 1.0 |
| Blackfoot: | 129.8 |
| Idaho Falls: | 15.7 |
| Ammon: | 6.8 |
| Preston: | 69.0 |
| Rupert: | 95.8 |
| Burley: | 83.7 |
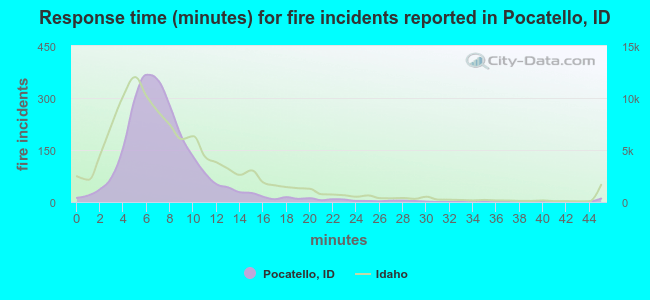 The median response time based on all reported fire incidents is 7 minutes. This is about the same as the Idaho median value.
The median response time in Pocatello, ID compared to nearest cities:
(Note: Based on data for all years, including only cities with at least 500 fire incidents)
| Pocatello: | 7 minutes |
| Chubbuck: | 8 minutes |
| Fort Hall: | 8 minutes |
| Blackfoot: | 8 minutes |
| Idaho Falls: | 7 minutes |
| Rigby: | 11 minutes |
| Rupert: | 6 minutes |
| Paul: | 6 minutes |
| Heyburn: | 6 minutes |
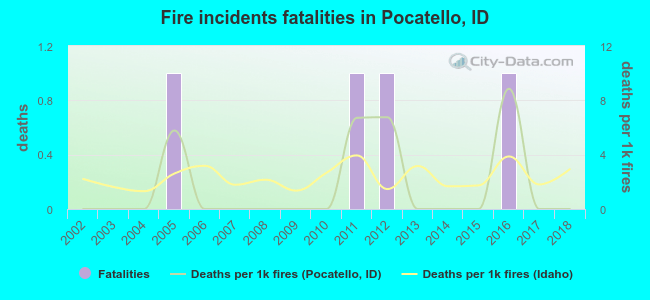 Based on the data from the years 2002 - 2018 the average number of fire-related yearly deaths is 0. The highest number of deaths - 1 took place in 2005, and the lowest - 0 in 2002. The data has a constant trend.
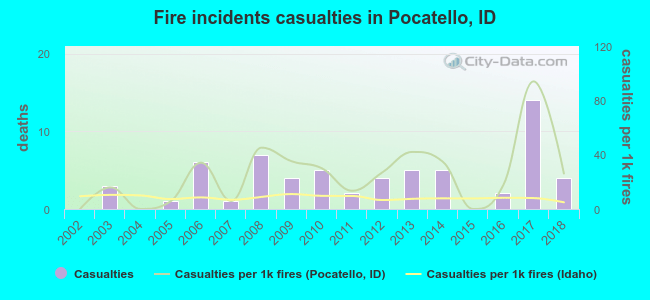 According to the data from the years 2002 - 2018 the average number of fire-related casualties per year is 4. The highest number of reported injuries - 14 took place in 2017, and the lowest - 0 in 2002. The data has an increasing trend.
The average number of casualties per 1,000 fire incidents is 25. This indicator was the highest - 94 in 2017, and the lowest 0 in 2002. The trend for injuries per 1,000 fire incidents is growing. Compared to the state value the number of casualties per 1,000 fire incidents is much higher.
According to the data from the years 2002 - 2018 the average number of fire-related casualties per year is 4. The highest number of reported injuries - 14 took place in 2017, and the lowest - 0 in 2002. The data has an increasing trend.
The average number of casualties per 1,000 fire incidents is 25. This indicator was the highest - 94 in 2017, and the lowest 0 in 2002. The trend for injuries per 1,000 fire incidents is growing. Compared to the state value the number of casualties per 1,000 fire incidents is much higher.
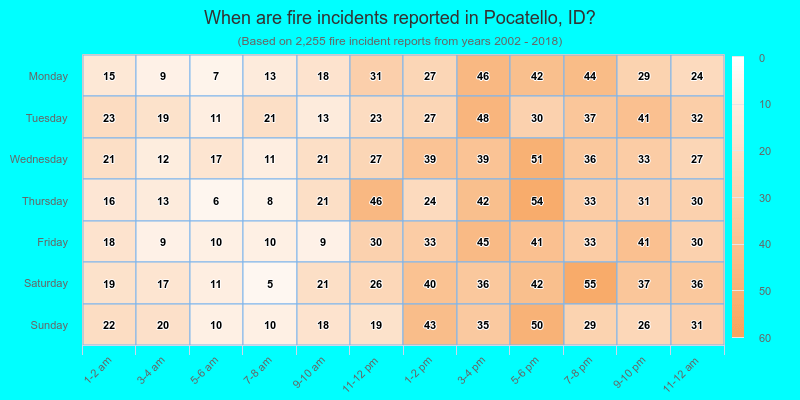
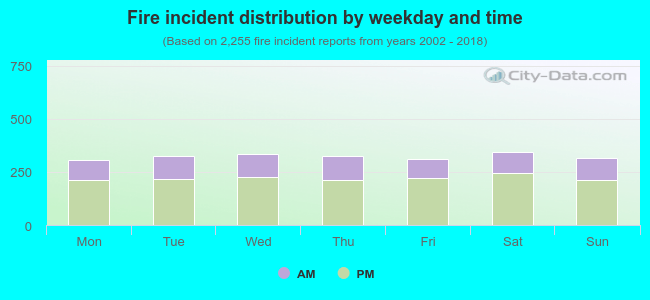 31.3% incidents where reported in the morning and 68.7% in the evening. The most fires (15.3%) took place on Saturday, and the least (13.5%) on Monday.
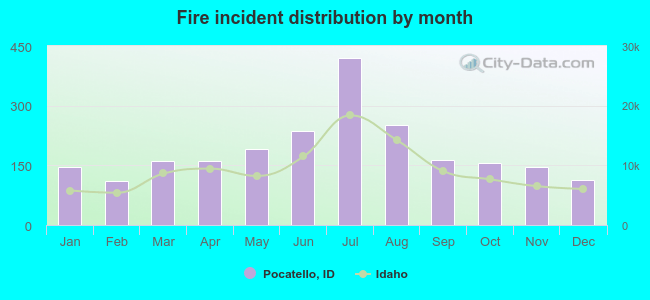 According to the 2,255 fire incidents from years 2002 - 2018 most fires (18.6%) took place during July, and the least (4.9%) in February.
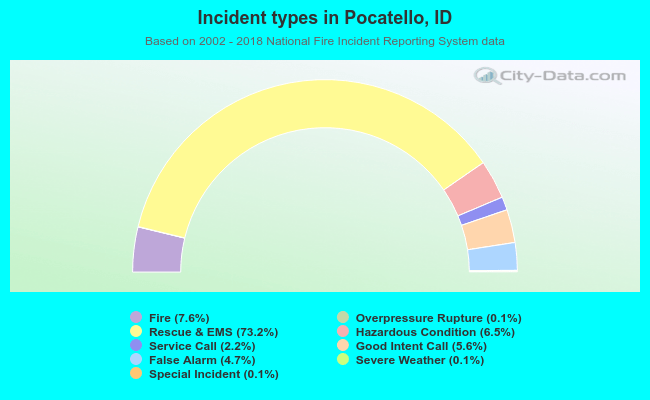 Out of all 29,852 cases reported during the years 2002 - 2018, the most belonged to the categories: Rescue & EMS (73.2%), Fire (7.6%), and Hazardous Condition (6.5%).
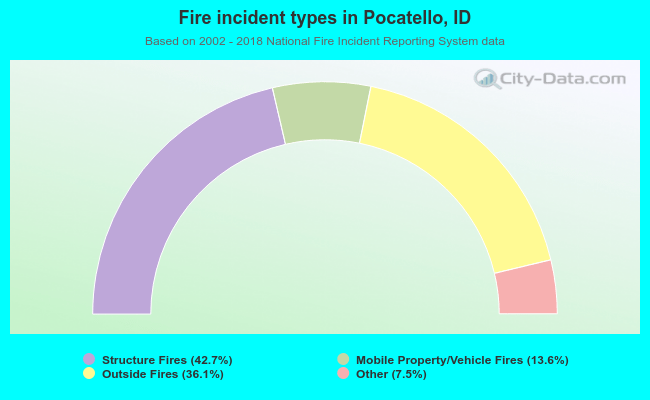 When looking into fire subcategories, the most reports belonged to: Structure Fires (42.7%), and Outside Fires (36.1%).