| Fire incidents reported |
|---|
| Sreet name | Count |
|---|
| POIPU RD | 36 | | HOONE RD | 16 | | LAWAI RD | 14 | | ALA KINOIKI RD | 12 | | PEE RD | 10 | | HOONANI RD | 8 | | HOOHU RD | 6 | | KIPUKA ST | 6 | | MAHAULEPU | 6 | | SHIPWRECKS BCH | 6 | | AINAKO BCH | 2 | | AINAKO RD | 2 | | AINAKO ST | 2 | | ALA KALANIKAUMAKA ST | 2 | | ALAKINOIKI | 2 | | CJM STABLES | 2 | | DIRT RD | 2 | | FRTING BRENNECK | 2 | | HAPA RD | 2 | | HOONA RD | 2 | | HOONANAI RD | 2 | | HOONE | 2 | | HOOWILI ST | 2 | | KAPILI RD | 2 | | KE ALAULA | 2 |
| | | Fire incidents reported |
|---|
| Sreet name | Count |
|---|
| KEONILOAMAHAULEPU PL | 2 | | KIAHUNA PLANT DR | 2 | | KIAHUNA PLANT. DR | 2 | | KIAHUNA PLANTATION | 2 | | KIAHUNA PLTN DR | 2 | | KIPUKAI RIDGELI | 2 | | KOLOA BYPASS | 2 | | KOLOA LANDING | 2 | | KOLOA ML | 2 | | KUAI | 2 | | KUAI RD | 2 | | KUKUIULA BOAT HARBOR | 2 | | LAWAI RD PAST KUKUIU | 2 | | LOKE PL | 2 | | LOPAKA PAIPA ST | 2 | | MAHAULEPU AREA | 2 | | MAKANUI ST | 2 | | NW OF CJ STABLE | 2 | | OLUOLU RD | 2 | | POIPU BEACH | 2 | | POIPU BEACH ESTATES | 2 | | RIGHTSIDE OF CJ | 2 | | SHIPWRECK'S PARKING | 2 | | SHIPWRECKS | 2 | | |
|
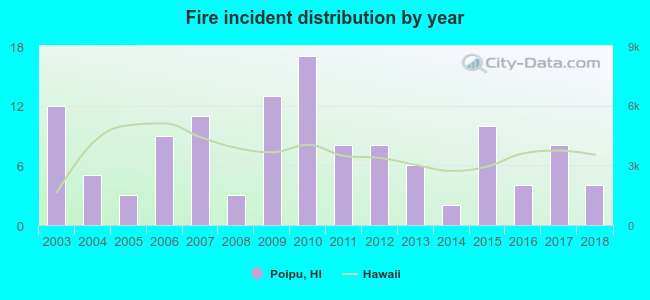 Based on the data from the years 2003 - 2018 the average number of fires per year is 8. The highest number of fire incidents - 17 took place in 2010, and the least - 2 in 2014. The data has a dropping trend.
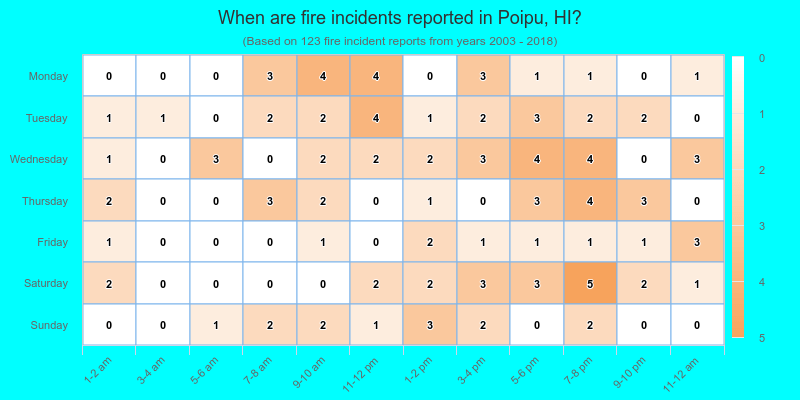
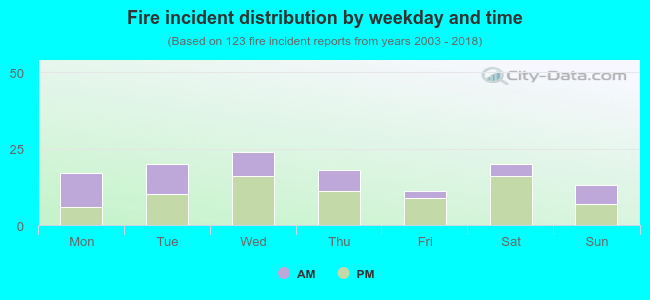 39.0% incidents where reported in the morning and 61.0% in the evening. The most fires (19.5%) took place on Wednesday, and the least (8.9%) on Friday.
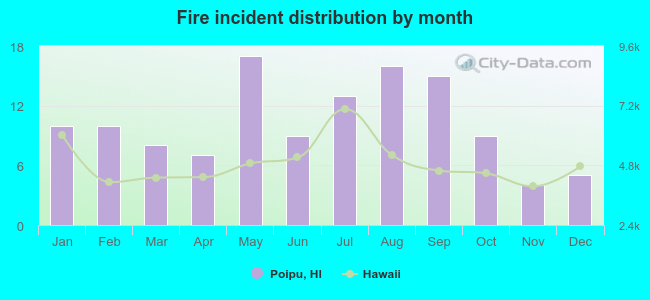 Based on the 123 fire incident reports from years 2003 - 2018 most fires (13.8%) took place during May, and the least (3.3%) in November.
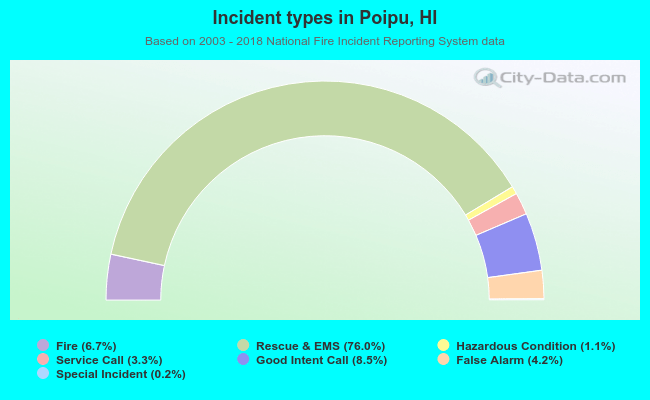 Out of all 1,829 cases reported during the years 2003 - 2018, the most belonged to the categories: Overpressure Rupture (76.0%), Service Call (8.5%), and Fire (6.7%).
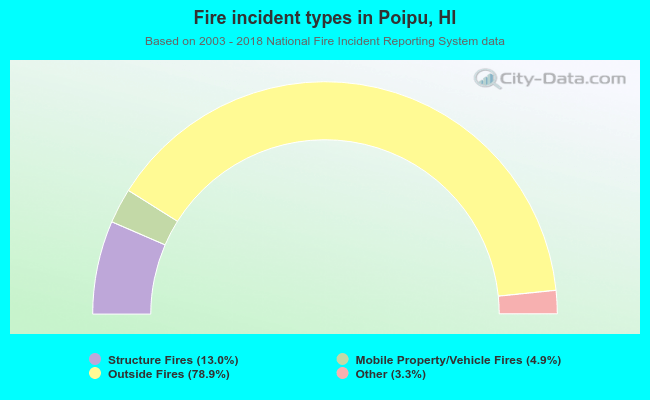 When looking into fire subcategories, the most reports belonged to: Outside Fires (78.9%), and Structure Fires (13.0%).