Prairie du Chien: Fire Incidents, Wisconsin (WI)
Where are fire incidents reported in Prairie du Chien, WI
Something went wrong! Please refresh the page.
|
| |||||||||||||||||||||||||||||||||||||||||||||||||||||||||||||||||||||||||||||||||||||||||||||||||||||||||||||
2004 - 2018 National Fire Incident Reporting System (NFIRS) incidents
- Incident types reported to NFIRS in Prairie du Chien, WI
- 17730.4%Fire
- 17730.4%Hazardous Condition
- 12721.8%False Alarm
- 386.5%Good Intent Call
- 366.2%Rescue & EMS
- 264.5%Service Call
- 10.2%Overpressure Rupture
- 10.2%Severe Weather
- Fire incident types reported to NFIRS in Prairie du Chien, WI
- 8246.3%Structure Fires
- 4123.2%Outside Fires
- 3620.3%Mobile Property/Vehicle Fires
- 1810.2%Other
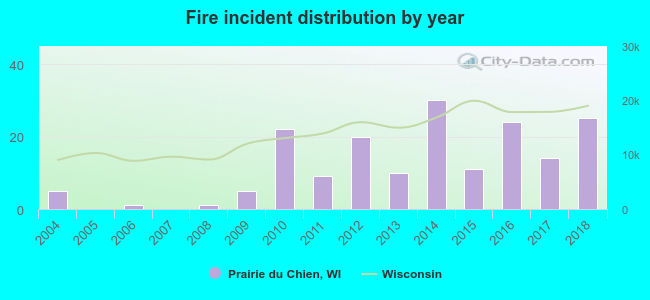 According to the data from the years 2004 - 2018 the average number of fires per year is 12. The highest number of reported fires - 30 took place in 2014, and the least - 0 in 2005. The data has a rising trend.
The average number of yearly fire incidents per 10k residents in Prairie du Chien, WI compared to nearest cities:
(Note: Based on data for the last 3 years, including only cities with population 5,000 and above)
| Prairie du Chien: | 36.5 |
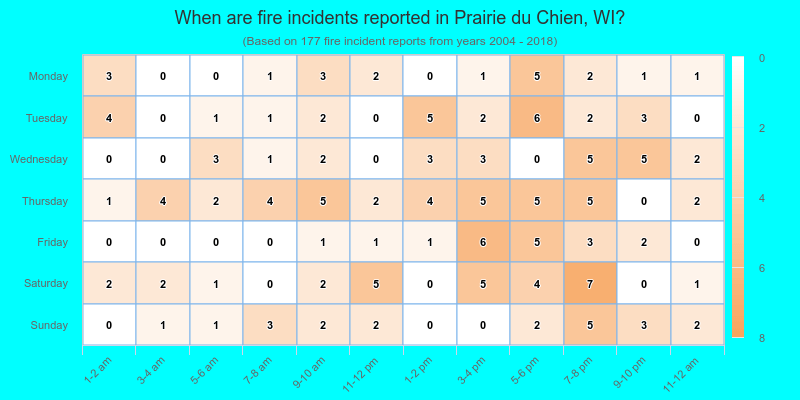
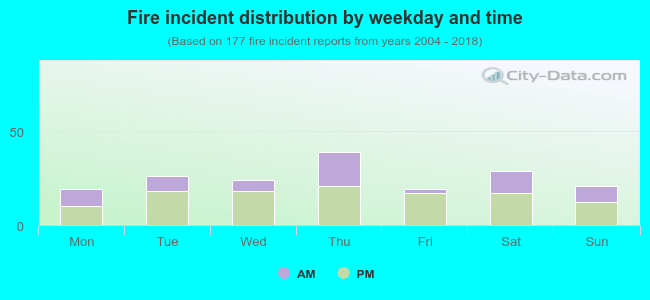 36.2% incidents where reported in the morning and 63.8% in the evening. The most fires (22.0%) took place on Thursday, and the least (10.7%) on Monday.
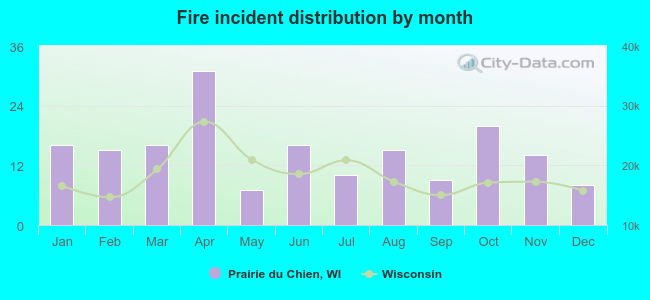 Based on the 177 fire incident reports from years 2004 - 2018 most fires (17.5%) took place during April, and the least (4.0%) in May.
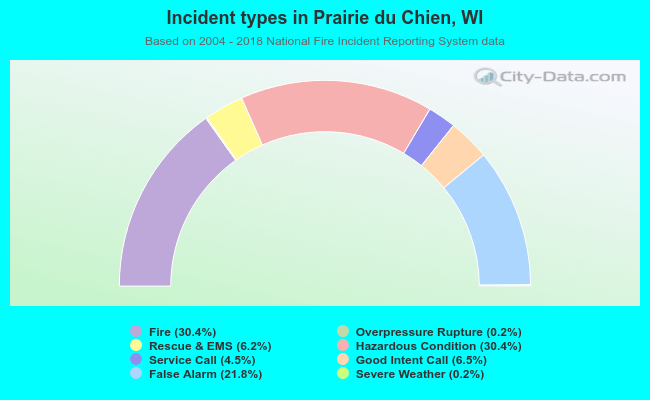 Out of all 583 cases reported during the years 2004 - 2018, the most belonged to the categories: Fire (30.4%), Hazardous Condition (30.4%), and False Alarm (21.8%).
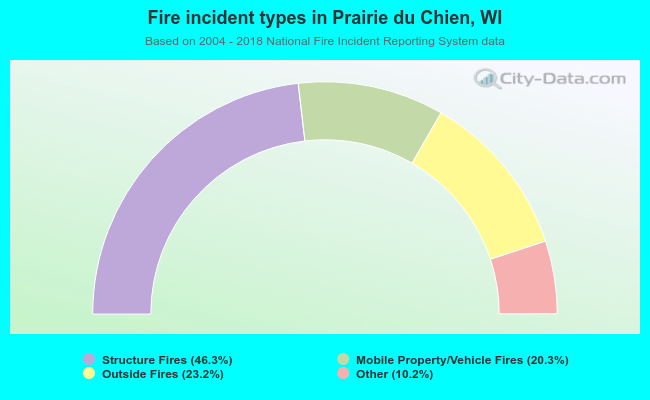 When looking into fire subcategories, the most incidents belonged to: Structure Fires (46.3%), and Outside Fires (23.2%).