Prior Lake: Fire Incidents, Minnesota (MN)
Where are fire incidents reported in Prior Lake, MN
Something went wrong! Please refresh the page.
|
| |||||||||||||||||||||||||||||||||||||||||||||||||||||||||||||||||||||||||||||||||||||||||||||||||||||||||||||
2002 - 2018 National Fire Incident Reporting System (NFIRS) incidents
- Incident types reported to NFIRS in Prior Lake, MN
- 4,23548.6%Rescue & EMS
- 1,27014.6%Good Intent Call
- 1,18613.6%Hazardous Condition
- 1,05812.1%Fire
- 7738.9%False Alarm
- 1732.0%Service Call
- 130.1%Severe Weather
- 110.1%Overpressure Rupture
- Fire incident types reported to NFIRS in Prior Lake, MN
- 56953.8%Structure Fires
- 26825.3%Outside Fires
- 14413.6%Mobile Property/Vehicle Fires
- 777.3%Other
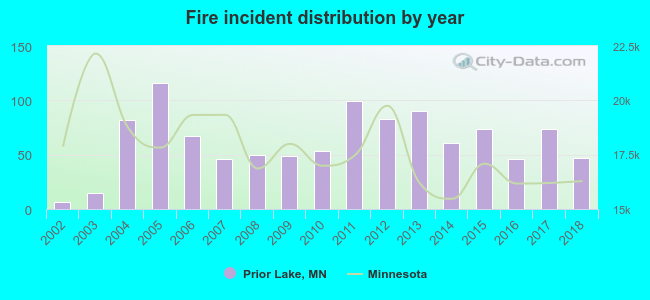 According to the data from the years 2002 - 2018 the average number of fires per year is 62. The highest number of reported fires - 116 took place in 2005, and the least - 6 in 2002. The data has a growing trend.
The average number of yearly fire incidents per 10k residents in Prior Lake, MN compared to nearest cities:
(Note: Based on data for the last 3 years, including only cities with population 5,000 and above)
| Prior Lake: | 22.2 |
| Savage: | 9.7 |
| Shakopee: | 24.1 |
| Burnsville: | 19.6 |
| Eden Prairie: | 15.2 |
| Lakeville: | 13.6 |
| Bloomington: | 21.2 |
| Chaska: | 13.6 |
| Jordan: | 35.7 |
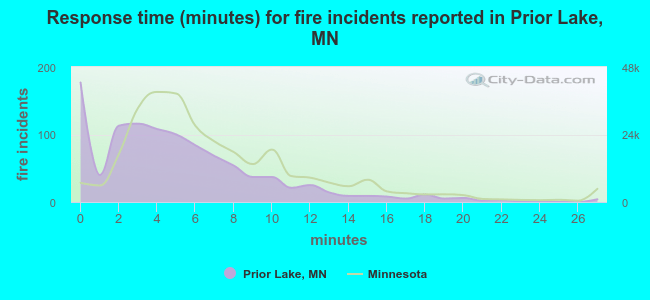 The median response time based on all reported fire incidents is 4 minutes. This is lower than the Minnesota median value.
The median response time in Prior Lake, MN compared to nearest cities:
(Note: Based on data for all years, including only cities with at least 500 fire incidents)
| Prior Lake: | 4 minutes |
| Savage: | 5 minutes |
| Shakopee: | 5 minutes |
| Burnsville: | 6 minutes |
| Eden Prairie: | 6 minutes |
| Lakeville: | 7 minutes |
| Bloomington: | 5 minutes |
| Chaska: | 4 minutes |
| Apple Valley: | 5 minutes |
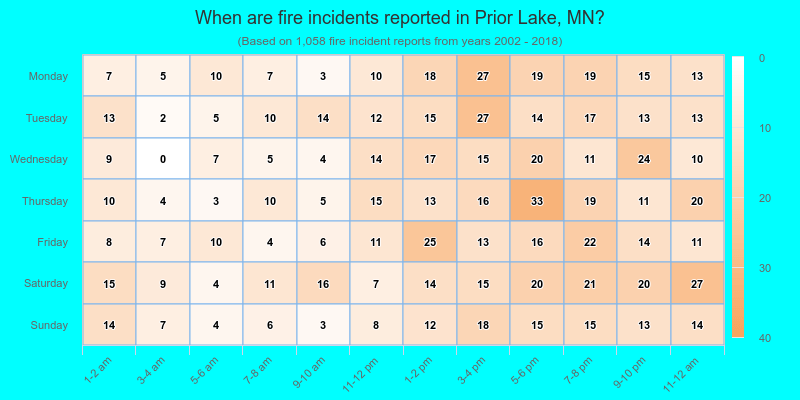
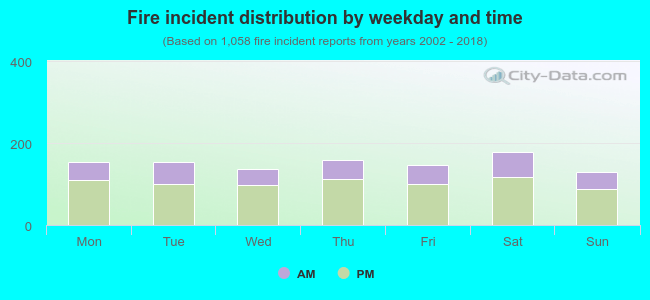 31.6% incidents where reported in the morning and 68.4% in the evening. The most fires (16.9%) took place on Saturday, and the least (12.2%) on Sunday.
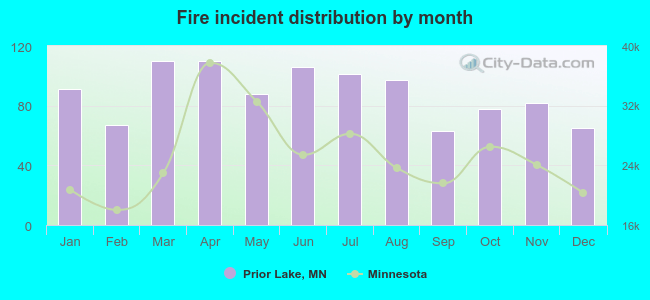 Based on the 1,058 fires from years 2002 - 2018 most fires (10.4%) took place during March, and the least (6.0%) in September.
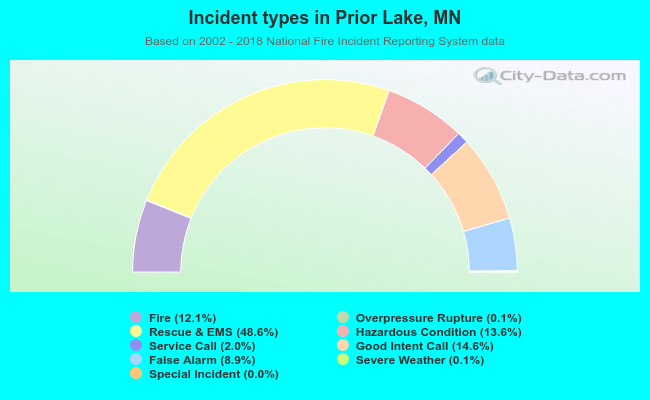 Out of all 8,720 cases reported during the years 2002 - 2018, the most belonged to the categories: Rescue & EMS (48.6%), Good Intent Call (14.6%), and Hazardous Condition (13.6%).
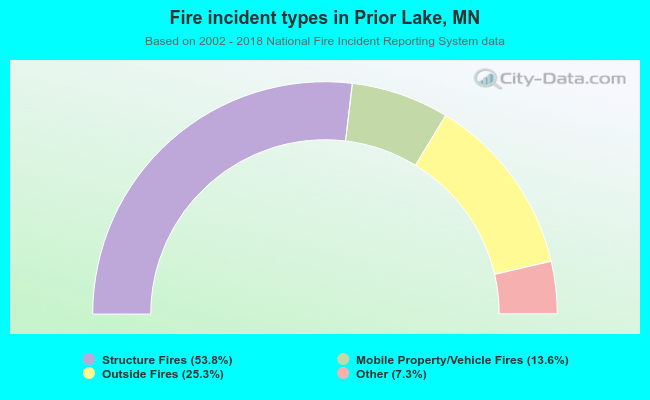 When looking into fire subcategories, the most incidents belonged to: Structure Fires (53.8%), and Outside Fires (25.3%).